Leading and lagging indicators
≈ 30 min read · 5,945 words
Monday morning you step on the scales, and you don’t like the number. The scales tell you exactly where you stand, but there is one thing they cannot do: undo last week’s dinners. What they measure has already happened. If you really want to lose weight, you should not stare at the scales; you should influence today the two numbers that shape next week’s weight: how many calories you eat, and how much you move. That is the difference between a leading and a lagging indicator, and exactly the same thing decides whether a plant’s safety and production KPIs shape the future or merely book the past.
A leading indicator measures influenceable activity that drives the future result; a lagging indicator measures an outcome that has already happened.
These are the two complementary types of performance measurement. The lagging indicator is easy to measure (financial result, injury rate, body weight) and shows precisely where you got to, but it is retrospective: what it shows has already happened, and it cannot be “turned” directly. The leading indicator, by contrast, measures a forward-looking, influenceable activity (safety walks completed, near misses reported, calories eaten) that predicts and drives the future result: harder to measure, but you can act on it in time. A good performance system uses both. The lagging indicator tells you whether you are heading for the target; the leading indicator tells you what to do today to get there.
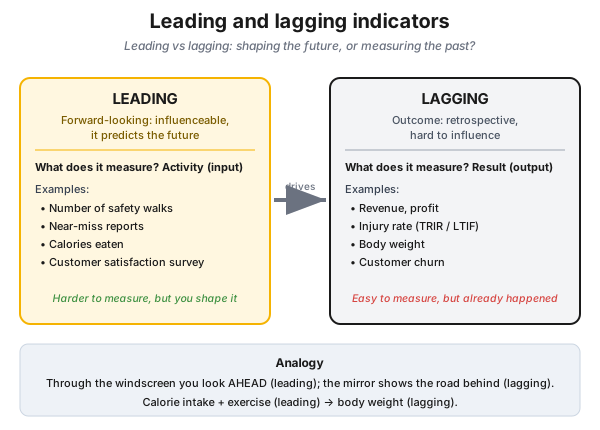 Figure 1 — the leading and the lagging indicator compared. The leading indicator measures the input, the activity (influenceable, predictive); the lagging indicator measures the output, the result (retrospective). The leading drives the lagging: that is why calories eaten and exercise taken shape the later body weight.
Who is this for?
Section titled “Who is this for?”This article is for those who measure performance, break targets down or run a team from a board: plant and shift manager · process engineer · HSE and process safety engineer · reliability engineer · Lean/CI specialist · production controller · asset team leader.
Learning objectives
Section titled “Learning objectives”After reading this article you will be able to:
- distinguish the leading and the lagging indicator, and justify what each one is good for;
- apply the two tests of a leading indicator (predictive and influenceable), and filter out the “vanity” metric;
- read the safety pyramid in the language of the two indicator types, and understand why more near-miss reports are good news (and why that alone is not enough);
- select a leading and a lagging indicator as a pair for a critical barrier, and assemble a balanced board of 3–5 indicators;
- place process safety indicators in the four-tier (Tier 1–4) framework;
- say when leading/lagging is not the right question, and what to do instead.
The essence
Section titled “The essence”In short: the lagging indicator measures what has already happened, the leading indicator measures what you do today and what drives the result. In a working performance system both are present, preferably in pairs, assigned to the same goal or the same barrier.
- Lagging = result. It measures what has already happened (profit, injury rate, body weight). Easy to measure, but retrospective and hard to influence. This is the rear-view mirror.
- Leading = activity. It measures what you do now and what predicts the result (a walk, a near-miss report, a workout). Harder to measure, but influenceable. This is the windscreen.
- The two marks of a leading indicator: predictive (it is connected to the future result) and influenceable (the team can act on it directly). If either is missing, it is not a useful leading indicator.
- The leading drives the lagging. A lagging indicator cannot be “set” directly; it only moves through the leading indicators, so that is where the work is.
- In safety this is vital: the injury rate (lagging) only speaks after the fact; the near miss, the unsafe condition and the observation (leading) give a chance at prevention.
- You need both. Watching only the lagging is steering the past; watching only the leading is not knowing whether you are on target. Together they give the full picture.
- A good KPI is often leading, actionable and influenceable. See the KPI / PI / I hierarchy (the KPI is lagging, the I is leading) and the KPI definition.
Why it matters (the stakes)
Section titled “Why it matters (the stakes)”Whoever watches only the lagging indicator drives from the rear-view mirror. The trouble is that by the time the lagging number goes wrong (the injury rate jumps, availability collapses, the profit melts away), the activity behind it happened or failed to happen long ago. Accountability can follow, but the window for intervention has closed.
The leading indicator is exactly what holds that window open. As long as you measure the leading activity (walks completed, near misses reported, corrective actions closed), there is something to act on before the lagging harm occurs. So the stake is not abstract: the leading indicator is the difference between prevention and explaining yourself afterwards. In safety that difference runs between an injury avoided and an injury sustained.
There is a quieter stake as well. Lagging safety indicators are rare, and therefore statistically “noisy”: a good quarter with zero injuries does not prove that the system is safe, only that nothing went wrong just then. Whoever sits back because of it will be caught out later by having ignored the leading precursors. The process safety literature names precisely this sitting-back as a separate risk: the passing of time without a process accident does not in itself prove that all is well, and may contribute to a dangerous and growing sense of complacency (Baker Panel report, 2007).
The most expensive misunderstanding belongs here too: a personal (occupational) safety indicator is not a process safety indicator. The analysis of the lessons from the Longford disaster puts it sharply: in a major hazard industry, relying on lost-time injury data (a lagging indicator) is itself a major hazard. The Texas City investigation drew the same conclusion: catastrophe-potential events (process upsets, loss of primary containment, fires, high-potential events) need separate leading indicators; tracking reportables of the slip, trip and spill kind is not enough. Behind good personal injury statistics, the very barriers that hold back a major event can be weakening quietly.
What is it, and where does it come from?
Section titled “What is it, and where does it come from?”The distinction is one of the oldest and most useful basic concepts of performance measurement. It was made widely known by the 4 Disciplines of Execution (4DX): the lagging measure is the goal you want to reach, and the lead measure is the few activities that most predict and influence reaching that goal.
The best-known teaching example captures the difference with the pairing of body weight and calories:
- Body weight is a lagging indicator: it measures the result precisely, but by the time the scales move, the eating and the exercise have already happened. Staring at the scales does not make you lose weight.
- Calories eaten and exercise taken are leading indicators: you influence them today, directly, and they predict next week’s body weight.
The two kinds of indicator answer two kinds of question. The lagging indicator answers “What did we achieve?” (result, what, the current state of the business), the leading indicator answers “How do we achieve it?” (activity, how, a prediction of the future). It is exactly this What / How logic that drives OGSM strategy deployment and the KPI cascade as well. On the OGSM table this even shows up in the columns: the Goal (dashboard) column carries the lagging indicators, the Strategies / Actions column the leading ones (for example the monthly count of leadership walks or of near misses reported). This is why process industry operating standards require that a leading and a lagging indicator be defined for every process and strategic area, cascaded all the way down to shift level.
What is the difference between a leading and a lagging indicator?
Section titled “What is the difference between a leading and a lagging indicator?”The two indicators are each other’s opposite on most of the points that matter. The key is influenceability: an indicator becomes “leading” by the team being able to move it with its own work. The contrast is a learning aid, not a rigid box: the same signal can be both leading and lagging depending on the reference point (that is what the second note below the table is about).
| Aspect | Leading | Lagging |
|---|---|---|
| What does it measure? | activity, input | result, output |
| Timing | forward-looking, preventive | retrospective, backward-looking |
| Influenceability | directly influenceable | hard to influence |
| Measurability | harder to measure and collect | easy, often automatic |
| Question | “How do we achieve it?” (how) | “What did we achieve?” (what) |
| What is it good for? | early intervention, steering | accountability, proof of result |
| Example (finance) | number of quotes, visits | revenue, profit |
| Example (safety) | walk, safety observation, test completed to plan | injury rate (TRIR / LTIF), process safety event |
| Analogy | windscreen | rear-view mirror |
The injury rate (lagging) cannot be “pushed down” by willpower; the number of weekly safety walks (leading) can. If the walks uncover and remove the risk, the rate falls after them. That is why in the performance dialogue we argue about the leading indicators, because those can still be acted upon.
How do you read the safety pyramid in leading/lagging terms?
Section titled “How do you read the safety pyramid in leading/lagging terms?”At the top of the safety pyramid stand the lagging harm outcomes (the damage that has occurred), at its base the leading precursors (the ones you can still act on). Prevention happens at the base: handling the precursors lowers the probability of the injury appearing at the top.
Nowhere is the leading/lagging distinction as important as in occupational and process safety. The classic safety pyramid can be read through the language of the two indicator types:
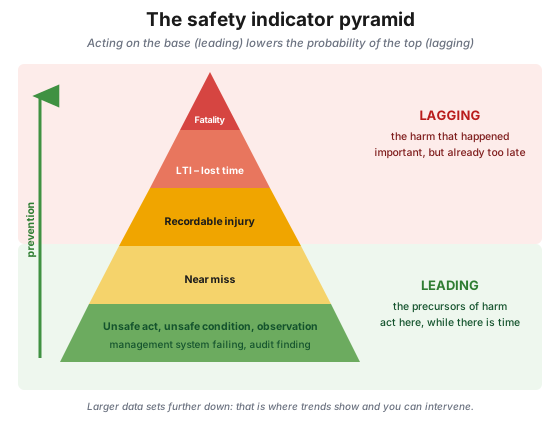 Figure 2 — the safety indicator pyramid. At the top the lagging harm outcomes: fatality, lost time injury (LTI), recordable injury, all damage that has already occurred. At the base the leading precursors: near miss, unsafe act and unsafe condition, safety observation, plus management system failings and audit findings. The shape of the pyramid is a statistical statement: further down, larger data sets are available, so that is where trends can be seen and interventions made.
- Lagging safety indicators count the harm that occurred: TRIR (total recordable incident rate), LTIF (lost time injury frequency), serious and fatal accidents. They are important and must be reported, but they are retrospective, and moreover rare, and therefore statistically noisy.
- Leading safety indicators measure the precursors that can be caught before they turn into harm: near misses reported (see near miss), unsafe conditions and acts uncovered, safety walks and observations completed, corrective actions closed on time, management of change and maintenance compliance, training delivered, the daily completeness of the safety cross.
The logic is simple: you intervene at the base of the pyramid (leading), because there is enough data there to see a trend, and because handling the base lowers the probability of the injury appearing at the top (lagging). This is not a one-to-one count: one near miss removed does not “buy off” one injury, and the data of the lower tiers, precisely because they are system- and facility-specific, cannot be aggregated or compared without limit against other plants. In a mature safety culture, however, a rise in near-miss reports is good news (we see and handle more), while the lagging rates fall.
How does this show up in the process industry?
Section titled “How does this show up in the process industry?”In the process industry the leading/lagging split is the backbone of measuring reliability and process safety: the lagging proves that we are heading for the strategic target, the leading gives the shift something to grip when intervening.
- Production: OEE and availability are lagging result indicators; completion of the standard operator round, the share of alarms handled (alarm management), and work orders closed on time are leading indicators that predict next month’s availability.
- Process safety: process safety events (LOPC, loss of primary containment) are lagging; compliance of safety critical equipment testing, handling of excursions from the integrity operating window, open PSSR items and the maintenance backlog are leading.
- Energy: specific energy consumption is lagging; the leaf-level, directly adjustable I indicators of the intervention tree (KPI / PI / I) (flue gas O₂, draft, feed preheating) are leading.
- Quality: final product inspection (testing the batch after it has been made) is lagging; statistical process control (SPC, see Six Sigma) shifts the emphasis away from exactly this, toward measuring and controlling the inherent variation of the manufacturing process, which is leading: if the process is capable and runs without excess variation, the product quality will certainly be good.
A process industry performance system therefore deliberately puts both indicator types on the performance board.
In the language of barriers: what does the leading indicator measure, and what the lagging?
Section titled “In the language of barriers: what does the leading indicator measure, and what the lagging?”In process safety the two indicator types take on a physical meaning. Major events rarely follow from a single cause: they need the simultaneous weakness of several barriers. On the classic “Swiss cheese” diagram (after James Reason) the slices are the barriers and the holes are their weaknesses; if the holes line up, the hazardous material or energy is released.
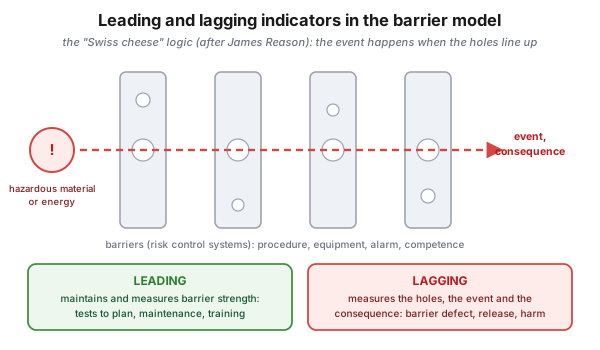 Figure 3 — the leading and the lagging indicator in the barrier model. The leading indicator maintains and measures the strength of the slices (the activity spent on maintaining the risk control system); the lagging indicator measures the holes, the event that occurred and the consequence.
- The leading indicator maintains and measures barrier strength: the activities of maintaining the risk control system (tests completed to plan, walks, training, procedures reviewed, competence assessment).
- The lagging indicator measures barrier defects, the events and the consequences: the number and size of the “holes”, the release that occurred and the harm.
From this follows the UK HSE principle of dual assurance: assign to every critical barrier one leading input and one lagging output indicator, and from how the two move together it becomes statistically judgeable whether the barrier is getting stronger or weaker. A public, process industry sample: leading = the percentage against plan of completed tests on the alarm system, lagging = the number of alarm system failures uncovered (from testing, near misses or actual events). Paired, the two show whether the maintenance and testing regime of safety critical alarms is effective enough.
The four tiers of process safety indicators (Tier 1–4)
Section titled “The four tiers of process safety indicators (Tier 1–4)”The process industry built a canonical, public framework on this logic: API RP 754 and the IOGP Report No. 456 built on and supplementing it sort process safety indicators into four tiers. Corporate process safety standards typically make this classification mandatory.
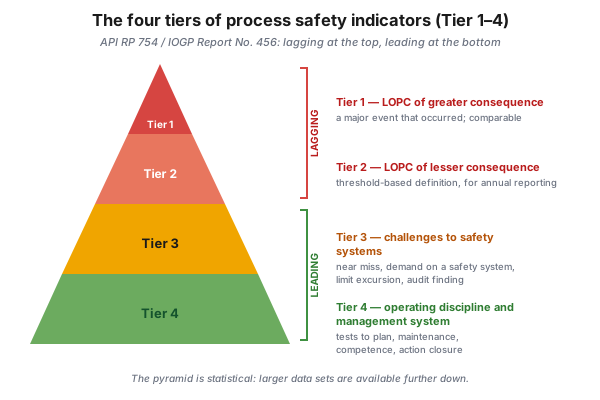 Figure 4 — the process safety indicator pyramid. Tier 1 and 2 are losses of primary containment of greater and lesser consequence that have occurred (lagging), Tier 3 is challenges to safety systems, Tier 4 is operating discipline and management system performance (leading).
| Tier | What does it measure? | Character |
|---|---|---|
| Tier 1 | loss of primary containment (LOPC) of greater consequence | lagging |
| Tier 2 | LOPC of lesser consequence | lagging |
| Tier 3 | challenges to safety systems: activation of a protective system or pressure relief device, excursion beyond the safe operating limit (SOL), an out-of-limit test result, an audit finding indicating barrier weakness, sub-threshold LOPC and near miss | more lagging, but it also gives leading information |
| Tier 4 | operating discipline and management system performance: tests and maintenance to plan, procedure review, competence assessment, closure of risk analysis actions, management of change | clearly leading |
There are two practical consequences. First, the definitions of Tier 1–2 are narrow and threshold-based, so they are comparable between companies and belong in the annual report, whereas Tier 3–4 indicators are facility- and system-specific and therefore not suitable for benchmarking; their place is in the improvement cycle of your own plant. Second, there are simply too few Tier 1–2 events for the strength of a barrier to be judged statistically, which is exactly why the Tier 3–4 levels are needed.
How do you build a balanced indicator set?
Section titled “How do you build a balanced indicator set?”A good indicator set starts from a lagging goal, finds the critical barriers or intervention points behind it, and puts the leading and the lagging indicator on the board in pairs. The six-step recipe of the process safety industry guidance works well on the production side too:
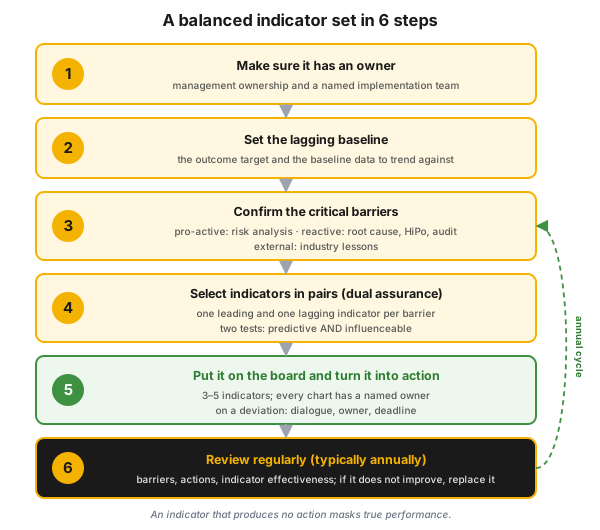 Figure 5 — building a balanced indicator set in six steps. Steps 3 and 4 (critical barriers and the indicator pair assigned to them) typically have to be taken up again every year.
- Make sure it has an owner. Without management ownership and a named, small implementation team (operations, safety, management) it is not worth starting. An indicator that produces no action is not only wasted effort, it also masks true performance.
- Set the lagging baseline. State the result you want to reach (for example “LTIF < 1.0”, “availability 97%”, “specific energy −5%”), and keep it from year to year so that there is something to measure the trend against. This comes from the What of the OGSM / strategy.
- Confirm the critical barriers: what drives this? Which few barriers or activities hold back the unwanted result? Three inputs help find them: pro-active (risk analysis, barriers identified by HAZOP and its relatives), reactive (root cause analysis, high-potential events, audit findings: where the holes already are), external (industry lessons, other people’s events). On the production side the same breakdown is given by the intervention tree (KPI / PI / I).
- Select indicators in pairs, and filter on the two tests. For every critical barrier one leading and one lagging indicator (dual assurance). Every candidate must be predictive (there is a causal connection) and influenceable (the team can act on it); drop whatever meets only one. Choose few: 4DX teaches the same, you need few but the most strongly causal leading indicators.
- Put them up, collect quality data, and turn it into action. Both types go on the performance board, with a target value and a colour code. On a shop floor team board the proven band is 3–5 indicators: below three it will not be balanced (leading and lagging, and safety, quality, cost, delivery, productivity), above five it thins out. Every chart should have a named owner who fills it in; a deviation calls for a dialogue and an action tied to an owner and a deadline. The goal is not “scoring” but the improvement action.
- Review regularly (typically annually). Go through the critical barriers, the open actions, the performance and the indicators themselves. If the leading indicator is met but the lagging one does not improve, the assumed cause-and-effect chain is wrong: replace the indicator. An indicator set is not forever; as the barrier gets stronger, a different weakness comes to the fore.
Putting it into practice / mini-scenario
Section titled “Putting it into practice / mini-scenario”This is how you would introduce it tomorrow. Pick a painful lagging goal, and find a real leading indicator for it.
- Safety example. The goal: fewer hand and finger injuries in the shift (lagging: number of recordable injuries). Ask what predicts this. Good leading candidates are the weekly number of safety observations and the closure rate of unsafe conditions uncovered. Both are influenceable (the team can observe more, close faster) and predictive (fewer undiscovered risks, fewer injuries). Put them on the weekly board next to the lagging goal, and from now on let the dialogue be about the leading indicators.
- Production example. The goal: 97% availability (lagging). Leading candidates are the completion of the standard operator round and the share of work orders closed on time. If these are high, next month’s availability will most likely hold the target.
Homework. Write down one important lagging goal of your own area. Find two leading indicator candidates for it, and answer for both: is it predictive? and is it influenceable? Whichever passes both tests can go on the board; whichever passes only one, cross it out.
Common mistakes
Section titled “Common mistakes”The most frequent mistakes come not from the definition but from the use: dropping one of the indicator types, an unchecked causal assumption, and the proliferation of indicators.
- Measuring only the lagging. Why it’s a problem: you drive from the rear-view mirror, and by the time the injury rate or the profit goes wrong, it is too late to intervene. Instead: always put at least one real leading indicator next to the lagging goal, and at a critical barrier in a pair (one leading, one lagging).
- Measuring only the leading. Why it’s a problem: plenty of activity, but nobody checks whether we are on target. Instead: always tie the leading indicator to the lagging result, and check the causal connection back regularly.
- A “vanity” leading indicator. Why it’s a problem: influenceable but not predictive (for example the number of e-mails sent); it moves, but signals nothing. Instead: always the double test (predictive and influenceable).
- Wanting to “set” the lagging. Why it’s a problem: the injury rate or the OEE cannot be turned directly. Instead: work on the leading activities; those move the lagging.
- Too many indicators. Why it’s a problem: focus and the readability of the board are lost, the indicators thin out. Instead: on a team board 3–5 indicators is the proven band (below three it is not balanced, above five it thins out), and keep the most strongly causal ones.
- Taking the personal injury indicator for a process safety indicator. Why it’s a problem: even with a good TRIR or LTIF, the barriers that hold back a major event can be weakening; the two do not measure the same thing. Instead: a separate process safety indicator set (Tier 1–4), with a leading and a lagging indicator per barrier.
- Treating a rise in near misses as bad news. Why it’s a problem: it suppresses the willingness to report, and destroys exactly the leading visibility. Instead: in a mature culture more reports mean better visibility; the real goal is a fall in the lagging rates, not “prettifying” the leading ones.
When NOT to use it? (the limits)
Section titled “When NOT to use it? (the limits)”The leading/lagging framework is strong, but it is not the answer to every question. Sometimes another tool is the right one:
| Situation | Why leading/lagging is not (primarily) the answer | The right answer |
|---|---|---|
| A certified safety function is needed (protection layer) | a well-performing leading indicator is not a protective barrier, and is not audited | LOPA / SIL, design to IEC 61511; the leading indicator accompanies this, it does not replace it |
| The causal chain is unknown | you choose a leading indicator without knowing whether it really drives the result | first uncover the cause (data, root cause analysis), then choose a leading indicator |
| A one-off, non-recurring event | there is nothing to keep on a board permanently for a single case | a one-off investigation and recording of the lesson |
| The leading indicator becomes gameable (driven as a number, not as content) | the indicator is “met” but the real activity is missing (a distorted incentive) | check back against the lagging; fewer, more substantial leading indicators; the dialogue asks why |
| You judge the safety performance of a major hazard facility from personal injury data | the personal (LTI-based) indicator is not a process safety indicator: even with a good rate, the barriers holding back a major event can be weakening | a separate process safety indicator set (Tier 1–4), with a leading and lagging pair per barrier |
| You do not say relative to what you call an indicator leading | the same signal can be leading and lagging depending on the reference point (a frequent alarm, for example) | name the reference point and the barrier the indicator belongs to |
Rule of thumb: leading/lagging is strongest for steering regular, measurable, causal performance. It is no substitute for certified safety protection or for an unknown root cause.
Take it home (keys)
Section titled “Take it home (keys)”- The leading is the windscreen, the lagging is the rear-view mirror. You shape the future through the leading; the lagging only reports where you got to.
- The two tests of a leading indicator: predictive and influenceable. If either is missing, it is not a leading indicator.
- The lagging cannot be set directly. It only moves through the leading, so work there.
- Few but real leading indicators: on a team board 3–5 indicators is the proven band, with the most strongly causal ones. Fewer is not balanced, more thins out.
- Measure in pairs: one leading and one lagging indicator for every critical barrier (dual assurance); how the two move together shows whether the barrier is getting stronger or weaker.
- In safety more near misses are good news: you intervene at the base (leading) so that the probability of the top (lagging) falls. But a near miss is a leading and a lagging signal at once, so a purely leading, barrier-level indicator is needed alongside it.
- The personal injury rate is not a process safety indicator. The two must be measured separately.
- Both go on the board: the lagging proves the direction, the leading gives the grip for intervention.
Self-test
Section titled “Self-test”- Why can a lagging indicator not be “set” directly, and what has to be moved instead?
- A team runs “the number of meetings held” as a leading indicator. Which of the two tests of a leading indicator does it fail, and why is it not a useful indicator?
- In a mature safety culture the number of near-miss reports rises. Why can this be good news, and on which lagging indicator do you then expect improvement?
Answer key
- Because a lagging indicator aggregates a result that has already occurred: the injury rate or the OEE cannot be “turned” directly, only through the activities behind them. That is why you must work on the leading indicators; those move the lagging.
- It passes the influenceable test (more meetings can be held at any time), but not the predictive test: it has no proven causal connection with the result. This is the classic “vanity” indicator; it moves, but signals nothing.
- Because a rise in the number of reports is primarily an improvement in visibility: we see and handle more precursors, not that more goes wrong. Improvement is expected on the lagging harm outcomes (TRIR, LTIF, serious injuries, the number of process safety events). An important nuance: a near miss carries leading and lagging information at once, so a barrier-level (Tier 4) leading indicator is needed alongside it, for example the percentage of safety tests completed against plan.
How does this show up in digital practice?
Section titled “How does this show up in digital practice?”Most leading indicators are shift-level activities, and these are exactly the ones a well-designed digital system records by itself. On paper a leading indicator easily remains an estimate or an after-the-fact memory; digitally it comes into being with a timestamp, an owner and a status, so the leading indicator cannot be “prettified” but becomes an auditable fact. The mechanism differs, the principle is the same: we make the activity that shapes the future measurable.
| Concept | Digital implementation | What it delivers |
|---|---|---|
| Leading activity (walk, observation) | a log entry with a timestamp and an owner | the leading measurement is not an estimate but an auditable fact |
| Near miss / unsafe condition | a structured reporting form, status tracking | the base (the precursors) becomes visible and manageable |
| Corrective action | an action list with a deadline and an owner | the age of open actions becomes a measurable leading indicator |
| Lagging result (rate, downtime) | an automatically aggregated indicator from the log data | the lagging can be traced back to the leading behind it |
| Balanced board | a digital performance board with a leading and a lagging column | the dialogue is directed at the influenceable leading indicators |
Connection to OPEREX (shift log)
Section titled “Connection to OPEREX (shift log)”Most leading indicators are shift-level activities: the operator round completed, the near miss reported, the safety observation, the equipment check, the corrective action closed, the briefing delivered. These are exactly the data a digital shift log (OPEREX) naturally records, with a timestamp, an owner and a status. This way the leading indicator is not an estimate but an auditable fact measured shift by shift: the number of near-miss reports, the completion of the walks or the age of open actions can be read off directly. And the lagging result (injury rate, downtime, availability) can be traced back to the presence or absence of the leading activity, with the audit trail of performance monitoring and measurement under ISO 45001 §9.1 (while the documented trail of the corrective actions arising from it serves §10.2). The shift log therefore makes the base of the pyramid (leading) measurable, which is the foundation of preventing the top (lagging).
Terminology (HU / EN / JP)
Section titled “Terminology (HU / EN / JP)”| Hungarian | English (canonical) | 日本語 (rōmaji) |
|---|---|---|
| vezető / előremutató mutató | leading indicator / lead measure | 先行指標 (senkō shihyō) |
| követő / utólagos mutató | lagging indicator / lag measure | 遅行指標 (chikō shihyō) |
| előrejelző | predictive | — |
| befolyásolható | influenceable / actionable | — |
| eredménymutató | outcome / result measure | 成果指標 (seika shihyō) |
| majdnem-baleset | near miss | ヒヤリハット (hiyari-hatto) |
| védelmi vonal | barrier / risk control system | — |
| kettős biztosítás | dual assurance | — |
| elsődleges határoló elvesztése | LOPC — Loss of Primary Containment | — |
| kieséssel járó baleset gyakorisága | LTIF — Lost Time Injury Frequency | — |
| regisztrálható esetek rátája | TRIR — Total Recordable Incident Rate | — |
What is the difference between a leading and a lagging indicator?
A lagging indicator measures a result that has already occurred (profit, injury rate, body weight, for example); it is easy to measure, but retrospective and hard to influence. A leading indicator measures a forward-looking, directly influenceable activity (safety walks, near-miss reports, calories eaten, for example) that predicts and drives the future result. The leading is the windscreen, the lagging is the rear-view mirror.
Why is it not enough to watch only the lagging indicators?
Because a lagging indicator only speaks after the fact: by the time it goes wrong, there is no way left to intervene. The leading indicator signals in time and is influenceable, so the end result can still be changed through it. Watching only the lagging is like driving from the rear-view mirror.
What makes an indicator a good leading indicator?
It has to pass two tests: it must be predictive (in a real causal connection with the future result) and influenceable (the team can move it with its own work). If only one holds, it is not useful: an influenceable-but-not-predictive indicator is a “vanity” number, while a predictive-but-not-influenceable one is just another lagging indicator.
How does this apply in safety?
Accident and injury rates (TRIR, LTIF) are lagging indicators; they count the harm that occurred. Unsafe conditions uncovered, safety walks and observations, tests completed to plan and corrective actions closed are leading indicators: they measure the precursors and the strength of the barriers, and intervening on those the accident can be prevented. Reporting a near miss gives leading and lagging information at once (it predicts the likelihood of an event, but also shows a barrier weakness that already exists), so more reports are good news in a mature culture, but not enough on their own: a purely leading, barrier-level indicator is needed alongside.
What is the Tier 1–4 framework in process safety indicators?
API RP 754 and IOGP Report No. 456 sort process safety indicators into four tiers. Tier 1 is loss of primary containment (LOPC) of greater consequence, Tier 2 of lesser consequence: both are lagging, and because of their narrow, threshold-based definitions they are comparable between companies. Tier 3 measures challenges to safety systems (activation of a protective system, excursion beyond the safe operating limit, near miss, audit finding), and Tier 4 measures operating discipline and management system performance (tests to plan, maintenance, competence, action closure): this last one is clearly leading. The pyramid shape is a statistical statement: further down, larger data sets are available, so that is where the strength of the barriers can be judged.
How does leading/lagging relate to the KPI/PI/I hierarchy?
Closely: the KPI is typically a lagging result indicator, while the directly adjustable I indicator beneath it is leading. The KPI cannot be set directly; it only moves through the leading I’s (see the intervention tree: KPI / PI / I).
Related concepts
Section titled “Related concepts”the KPI / PI / I hierarchy · the KPI definition · the KPI cascade · performance management · the performance board · the performance dialogue · OGSM · OEE · near miss · the safety cross · the standard operator round · HAZOP · LOPA / SIL
Next step
Section titled “Next step”If you have understood this, from here it is worth going on — in this order:
- the KPI / PI / I hierarchy — the intervention tree, which breaks the lagging KPI down into leading, directly adjustable I indicators. This gives you the method for finding leading indicators.
- the performance board — how you put the leading and the lagging indicator on one board together, with a target value and a colour code.
- the performance dialogue — how you run the conversation about the influenceable leading indicators, with an action tied to an owner and a deadline.
References / further reading
Section titled “References / further reading”- API RP 754: Process Safety Performance Indicators for the Refining and Petrochemical Industries. American Petroleum Institute, 2010 — the source standard of the four-tier (Tier 1–4) framework of process safety indicators.
- IOGP (OGP) Report No. 456: Process Safety — Recommended Practice on Key Performance Indicators. International Association of Oil and Gas Producers, 2011. The public, detailed methodology of the Tier 1–4 framework, the dual assurance leading/lagging pairs and the six-step KPI selection.
- Robert S. Kaplan – David P. Norton: The Balanced Scorecard. Harvard Business Review Press, 1996 — the canonical foundational work on leading and lagging indicators and on the link between strategy and metric.
- Chris McChesney, Sean Covey, Jim Huling: The 4 Disciplines of Execution. Free Press, 2012 — the widely read source of the lead measure / lag measure distinction.
- HSE (UK Health and Safety Executive): HSG254 — Developing process safety indicators. The recognized, public framework of the leading and lagging safety indicator pair; the dual assurance principle comes from here.
- Raymond C. Floyd: Liquid Lean: Developing Lean Culture in the Process Industries. CRC Press, 2010 — SPC as a leading indicator in place of final product inspection (lagging).
- Baker Panel: The Report of the BP U.S. Refineries Independent Safety Review Panel, 2007 — the risk of complacency when there is no leading indicator for process safety.
- ISO 45001:2018 — occupational health and safety management system; the standard for the audit trail of performance monitoring and measurement (§9.1) and of corrective actions (§10.2).