Performance Management — the engine of the Management Infrastructure
≈ 25 min read · 5,035 words
“I come to work to earn money. I don’t really have goals, other than making as much product as I can.” An operator said this at a Lean workshop. In the same room someone else said: “We talk about flow and pull, but I’m still rewarded for machine speed and machine efficiency.” Two well-meaning people who cannot even see what the organization is collectively trying to achieve, because the system that ties their daily work to a goal is missing. That system is exactly what performance management is: the mechanism that connects strategy to what actually needs to be done at the panel this morning. Let’s look at what it is, what it consists of, and why most improvement efforts fail without it.
Performance management is the closed-loop management system that aligns business goals to a shared intent and drives improvement through PDCA. It creates clear focus and accountability at every level of the organization, and its five elements together close a PDCA loop: (1) clear metrics, targets and accountability; (2) realistic budgets and plans; (3) effective performance tracking; (4) robust performance dialogue; (5) rewards, consequences and actions. It works like a car dashboard: for every indicator it shows the actual value against the target, and it puts a correction lever in your hand so you can intervene in time — because performance that has already fallen below target cannot be corrected retrospectively, the problem has to be prevented.
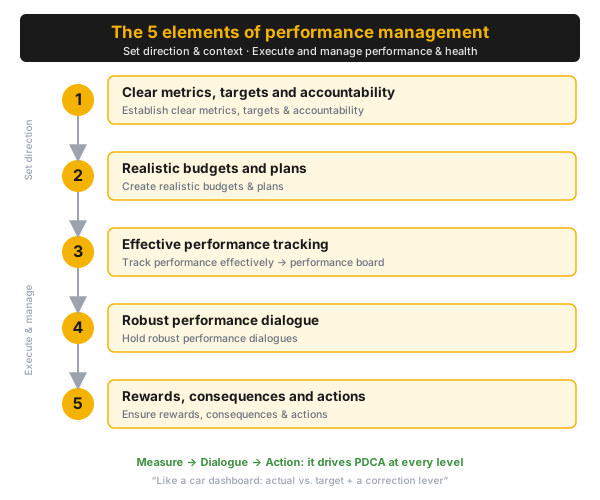
Figure 1 — the performance management model as it appears in the source deck: under set direction (Set direction & context) the targets and the plans, and below them the five numbered elements of execution and management (Execute and manage performance & health): metrics/targets, plans, tracking, dialogue, rewards/actions. The Measure → Dialogue → Action loop is what drives PDCA.
Who is this for?
Section titled “Who is this for?”This article is for those who actually measure, discuss and improve performance in daily operations: shift supervisor · plant manager · process engineer · production planner · process and improvement engineer · HSE specialist · Lean/CI specialist · team and area leader.
Learning objectives
Section titled “Learning objectives”After reading this article you will be able to:
- explain the five elements of performance management, and how they close a PDCA loop;
- distinguish the five elements of the MI lens from the five elements of performance management itself (the two are nested);
- trace how OGSM cascades from the corporate vision down to shift level (the “how” of the level above becomes the “what” of the level below);
- recognize why plain KPI tracking is not performance management, and what is missing from it;
- draw the boundary: when this is not the right answer (for example a certified safety function, or a one-off event).
In brief
Section titled “In brief”- Performance management is the engine of the Management Infrastructure (MI) lens: it is the main way an organization makes sure it is taking the right actions to execute strategy and create value.
- The five elements of execution: metrics/targets/accountability, realistic plans, effective tracking, robust dialogue, rewards/consequences/actions. The physical arena for tracking, dialogue and action is the performance board.
- The car dashboard analogy: a few balanced indicators, actual against target, and a correction lever. Watching the dashboard is not enough, you also have to act.
- Measurement on its own is not enough: observations have to be turned into action. Plain KPI tracking is not performance management; a deviation must always be followed by dialogue and action.
- Many Lean improvements fail because of poor performance management: if the incentives (rewarding machine speed, say) contradict the flow and pull goals, the gain will not be sustained.
- The targets come from OGSM, and they cascade level by level (What/How); the review rhythm is tiered: per shift on the front line, then weekly, monthly and quarterly further up.
- Capability is the bottleneck: information is only half the story, people need the skills to ask the right questions, decide and plan actions; this has to be built through coaching and training.
Why does it matter? (the stakes)
Section titled “Why does it matter? (the stakes)”What is at stake in performance management is whether Lean tools degrade into a one-off campaign or mature into lasting improvement. A recurring lesson from workshops is that most operational improvements fail not on the tool, but on the missing performance management: everyone talks about change, and everyone carries on doing what their own department considers “best.”
The mechanism is simple and insidious. A deviation on the board costs almost nothing as long as it is caught. But with no dialogue and no action, nobody goes after the root cause, the problem slips into the next shift, gets forgotten there, and then grows. And if the incentives meanwhile reward something other than what the strategy asks for, the gain slides back and the improvement becomes unsustainable.
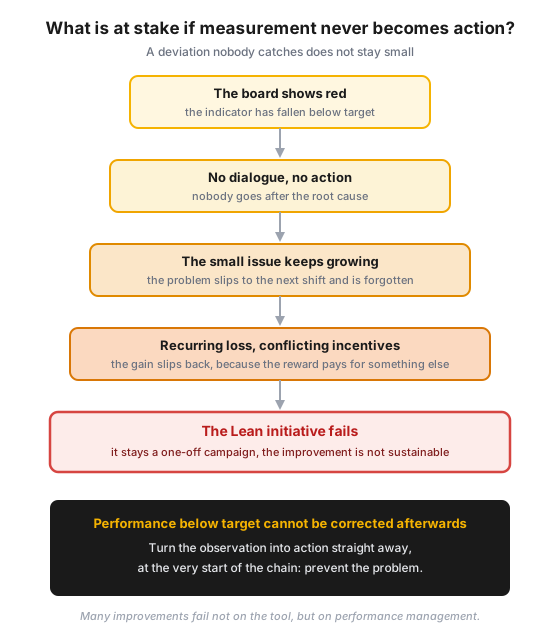
Figure 2 — the escalation of a deviation nobody catches: a red board is cheap in itself, but without dialogue and action the end of the chain is the failure of the Lean initiative. Performance below target cannot be corrected afterwards, the problem has to be prevented.
The lesson: performance management is not administrative overhead, it is the system that keeps improvement alive at all. It supports flow, reduces variation, and makes continuous improvement sustainable.
What is it and where does it come from — the Management Infrastructure lens
Section titled “What is it and where does it come from — the Management Infrastructure lens”Performance management is the engine of one of Lean’s organizational lenses, the Management Infrastructure: it is the formal system through which business goals become daily, measurable action. One of the three Lean lenses is the Management Infrastructure (MI): “the formal structures, processes and systems through which human and organizational resources are directed and optimized towards shared goals.” The five elements of MI are (for the full framework see the Management Infrastructure hub article):
- The performance management process — how business goals are broken down into human and business performance indicators, and how those are reviewed (the subject of this article).
- Organizational structure — span of control, decision rules, clarity of roles and responsibilities.
- Capability building — how well skill development fits the company’s needs and individual roles.
- The structure of continuous improvement — how effective the CI processes and tools are, and how improvement ideas are turned into action (kaizen, pdca).
- Functional supports — how effectively the other functions and departments serve production.
Of these, performance management is the engine: it is what brings the rest into tune. It helps in three ways: (1) it aligns every business goal to a shared intent; (2) it gives everyone clear focus and accountability; (3) it drives PDCA-based continuous improvement at every level of the organization.
What are the five elements, and how do they close a loop?
Section titled “What are the five elements, and how do they close a loop?”The five elements of performance management fall into two phases: setting direction (Set direction & context) fixes the goal and the plan, while execution and management (Execute and manage performance & health) tracks performance, discusses it and closes it with consequences. The model rests on “measure stakeholder value”: measurement starts from stakeholder value. The source material introduces the model under the name “Performance Wheel” (as an agenda heading), but the actual diagram is not a spoked wheel — it is the five-element structure split into phases (see Figure 1).
1) Clear metrics, targets and accountability
Section titled “1) Clear metrics, targets and accountability”The targets originate in the OGSM (Objectives, Goals, Strategies, Measures) strategy deployment. The “What” (Objective + Goal) and the “How” (Strategy + Measure) pair up what we measure with how we will achieve it. Targets cascade level by level: the How of one level (Strategy & Measure) becomes the What of the level below it (Objective & Goal) — from corporate level (Tier 1) through the area or asset team and the plant, down to equipment and shift level.
A good indicator is a KPI, and targets are SMART (Specific, Measurable, Attainable, Realistic, Time-bound); for the detail see the KPI definition, the KPI cascade and the KPI/PI/I hierarchy articles. The key point: the target figures on the board must match the numbers in the OGSM, and accountability must be assigned unambiguously.
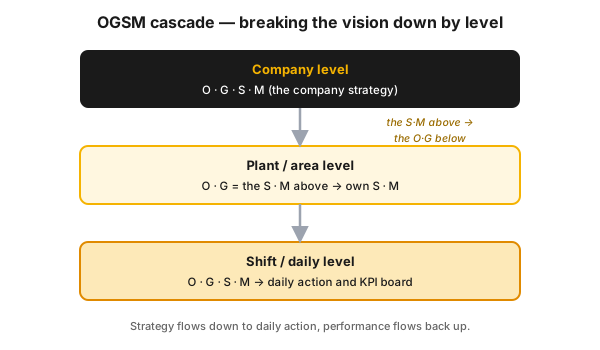
Figure 3 — the What/How cascade: the Strategy & Measure of the upper level becomes the Objective & Goal of the level below, all the way down to equipment and shift level.
2) Realistic budgets and plans
Section titled “2) Realistic budgets and plans”Once the what (the target) is settled, the how follows. The key planning questions are: How do we intend to reach the target? Where is the biggest improvement opportunity? Do we know the current situation? What do we need? The resources required: trained people, time, expertise, material, equipment, support. Once you have the answers, write the plan down, assign resources to every activity, start executing, track it, and talk about performance. The budget has to be realistic: an over-ambitious plan and a token one both undermine the dialogue.
3) Effective performance tracking (track)
Section titled “3) Effective performance tracking (track)”Tracking is visual: we take in most information visually. The essence of visual management is the use of controls that allow an individual to recognize the standard, and any deviation from it, immediately. The physical tool is the performance board: it displays a handful of key indicators with their targets, updated by hand and colour-coded (blue for the target, red for below target, green for the value achieved), and it serves the regular review. A good indicator is updated frequently (process and energy parameters hourly, maintenance and logistics per order), is visual, makes the gap easy to see, and is relevant to the process. The guiding principle: track the vital few — follow the few that matter, not everything.
The indicators to track cover four areas (SQDP): safety (LTA, minor injuries, hazardous events), quality (internal and external complaints, scrap), service/delivery (OTIF, days of inventory, over/under) and productivity (output, downtime). A red value requires a mandatory comment, so that the deviation triggers root cause analysis and action.
Measurement on its own is not enough: observations have to be turned into action. Performance below target cannot be corrected retrospectively: the problem has to be prevented.
4) Robust performance dialogue
Section titled “4) Robust performance dialogue”Tracked numbers are only worth something if they are followed by dialogue (not a monologue): a productive, shared working session, joint problem identification and problem solving, focus on the indicators falling short of target, with clear action ownership (who, what, by when). The dialogue runs at tiered frequencies: per shift or in real time on the front line, then weekly, monthly and quarterly further up. The guiding principle: at least 80% of problems should be solved where they arise, and if an action is not resolved within one week, it must be escalated to the next level. For the detail see the performance dialogue article.
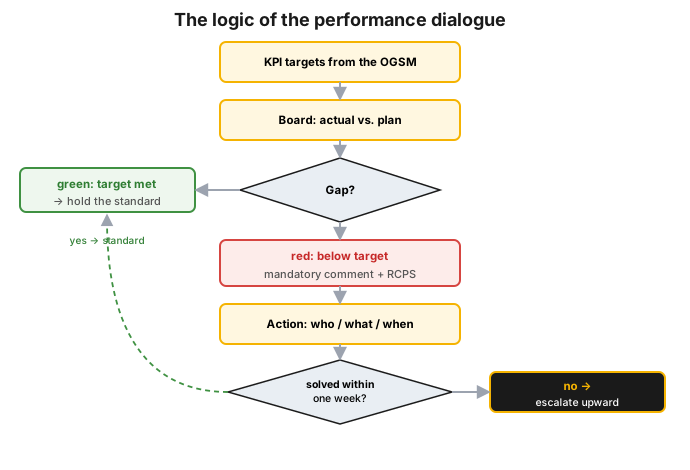
Figure 4 — the logic of the performance dialogue: from the KPI targets coming out of the OGSM to the actual vs. plan board, the deviation branch (green: hold the standard; red: mandatory comment + RCPS), the recording of the action with who/what/when, and finally the one-week escalation.
5) Rewards, consequences and actions
Section titled “5) Rewards, consequences and actions”Handling rewards and consequences is where many companies are very weak. When the workforce understands the rewards and consequences of their own performance, and sees them applied fairly to their peers and their superiors too, the whole process becomes far easier to manage. Feedback (recognition and consequences) is therefore not an optional extra but the closing element of the system: without it, the dialogue empties out into a conversation with no consequences.
Where do the targets come from? — OGSM and setting direction
Section titled “Where do the targets come from? — OGSM and setting direction”Targets don’t come out of thin air: the OGSM (Objectives, Goals, Strategies, Measures) strategy deployment is what ties the target figures on the board to the corporate vision. OGSM is a practical variant of the Japanese Hoshin Kanri, made widely known by Procter & Gamble in the 1990s, and it is regarded as a world-class tool.
- The four elements and the iron rule:
O = words(what we want),G = a number(the target value),S = words(how we will achieve it),M = a number(the measure of execution). One objective may have several strategies. - The cascade: the Strategy + Measure of the tier above becomes, by “cut and paste”, the Objective + Goal of the tier below. In other words, the “how” of the upper level becomes the “what” of the lower level, which is how the corporate vision reaches down to shift and equipment level.
- “The objectives are given, but the strategies take creativity”: the upper level dictates the goal (a single direction), while the lower level, the one that knows the process, works out how to deliver it (commitment).
- The rope analogy (why consensus is needed): four people pull a weight from A to B with a rope and pulleys. If their goals are inconsistent and imposed from above, the resultant force is
1+1+1−1 = 2(50% efficiency); if the OGSM is built by consensus and the goals are aligned,1+1+1+1 = 4(100%). - The bridge to the board: the target values on the performance board must match the numbers in the OGSM, otherwise the front line and the strategy drift apart.
The full OGSM process (vision → top tier → cascade → individual charter, the supporting review rhythm, the timings and a complete Tier 1 example) has its own article: ogsm. Here we only pick out what is needed for the “set direction” element of performance management.
The “dashboard” and capability building
Section titled “The “dashboard” and capability building”The car dashboard analogy. Performance management works like a car dashboard: there are performance indicators (actual against target) and correction levers. This calls for a not-too-large, balanced set of indicators; clear, appropriate targets; visualization (tracking); and corrective plus preventive actions. Watching the dashboard is not enough, you also have to steer.
Capability building. The right information is only half the story. For the system to be genuinely effective, people need the skill to use that information: to decide, to solve problems, to plan actions. The hard part is building those skills through training and coaching, which takes time, and the key is asking good questions. Running a good meeting often demands a fundamental change in attitude and behaviour from team members; understanding this is one thing, delivering it is quite another, and takes weeks or months of continuous feedback and coaching. The structured steps of capability building are: (1) understand what skills are needed to run the operating system; (2) assess the skills that already exist; (3) build development plans to close the gap; (4) build talent for the future. The goal is a capable and flexible workforce.
How do you roll it out in practice?
Section titled “How do you roll it out in practice?”You don’t introduce performance management everywhere at once — you start from a pilot area and follow the PDCA logic: begin with a small, successful example, then spread it. The established rollout roadmap (organized around the performance board) has six steps:
- Introduce the concept to the implementing team and to production management. “Sell” the purpose of the board thoroughly, but the fact of the rollout is not up for debate; use examples, demonstrate or simulate a review.
- Choose a pilot area (two or three areas, preferably with a positive attitude, to serve as good examples for the further rollout), and identify the key stakeholders (operators, team leader).
- Define the content of the board: a balanced set of indicators from the four areas (safety, quality, service, performance); involve the stakeholders in choosing indicators and targets, to create ownership; focus on the vital few, with a clear link to the KPIs above.
- Design the review: a clear agenda, participants, rules, roles, preparation and duration. In the early days, “shadow” the meetings frequently and give feedback; key leaders should shadow too, to back the rollout.
- Build it, install it, start using it: the board should be built by the teams who will work with it (ownership), preferably updated by hand, close to the equipment. Attention is critical in the first weeks, and a lot of time has to go in before the first return.
- Develop it: once the team handles the basics well, add more indicators, train them in RCPS tools, introduce problem and improvement tracking (T-cards, for instance), adjust the targets, then repeat on the next boards with what you have learned.
Hands-on — the “catchball” simulation
Section titled “Hands-on — the “catchball” simulation”The classic, source-faithful exercise for the rollout is “catchball” (cascading with a ball):
- Give a ball to the senior manager. It represents the business strategy they have worked out.
- Ask another participant to represent the rest of the organization, with their hands in their pockets. The manager now throws the ball to them without warning: this is how they “cascade” the vision and the goals. The ball, naturally, drops.
- The manager feels they have communicated the vision; in reality we tend to spend our time working out the strategy (perfecting the “throw”), not deploying it.
- Now have the participant take their hands out of their pockets, and have the manager say: “Now we throw the ball to each other.” That back-and-forth throwing is consensus building during the cascade: this is the only way an OGSM reaches the lower levels in workable form.
Mini-scenario (how to start tomorrow). Pick a painful, recurring deviation in your own area (the log, the near-miss reports or the gemba will show it). Put three indicators from the four SQDP areas on a single board, each with a target from the OGSM. Hold a short, stand-up dialogue every day: for every red indicator, a comment and a single action (who, what, by when). After a week, check how many actions were closed; escalate the ones still open.
Measurement and audit — what to look at in performance management
Section titled “Measurement and audit — what to look at in performance management”You don’t measure the health of performance management by the number of boards, but by whether deviations really do turn into actions, and actions into closed solutions that address the root cause. A few practical indicators:
| What you measure | Why this one | Good sign |
|---|---|---|
| Action closure rate (to due date) | the most common breaking point of the system sits between elements 4 and 5 | the share of open actions falls, old items do not pile up |
| Escalation time | if an action stays open beyond 1 week, it must be escalated | the one-week rule really works, items do not get stuck |
| Share of red indicators with a comment | a red value without a comment triggers no action | (close to) 100% of red values carry a comment and an action |
| Target–OGSM match | the target on the board should match the OGSM | no gap between the front-line and the strategic target figure |
| Dialogue discipline | regular, prepared, action-oriented meetings | the meetings keep their rhythm, participants come prepared |
The target logic here is the same as with poka-yoke: the aim is not quantity (how many boards, how many indicators), but that the critical deviations genuinely become actions and closed solutions, resolved at the lowest possible level.
Process-industry and safety context
Section titled “Process-industry and safety context”In the process industries, performance management sets top-down targets on the focus KPIs and then breaks them down to equipment and shift level, so that the panel operator can see the indicator they themselves can influence. A typical breakdown: specific energy consumption [GJ/t] for the distillation, olefin or polymer block; plant availability [%]; the number of unplanned shutdowns. Tracking is tiered: a whiteboard, a SEMAFOR display or a DCS screen updated hourly on the front line, dynamic reports at block and plant level, and a fortnightly or monthly review at management level. (Specific internal target figures are confidential operating data; in the web material they are treated as examples and anonymized, not as general benchmarks.)
Safety emphasis. In a Seveso plant the prevention mindset is critical: safety performance below target cannot be “corrected afterwards”. The first item on the review agenda is typically the safety topic; tracking near-misses and hazardous events makes the HSE picture visible on the front line and triggers corrective action before the loss escalates. At the same time, performance management does not replace certified functional safety layers (LOPA/SIL, IEC 61511); designing those is a separate task governed by the standards.
Common mistakes
Section titled “Common mistakes”The mistakes are best read paired with the correct practice:
- “Just tracking KPIs”, with no dialogue and no action. Why it hurts: this is not performance management, it is data collection. Instead: every deviation should be followed by a dialogue and a single action tied to an owner.
- Measurement is not turned into action. Why it hurts: the action addressing the root cause never happens, and a small issue keeps growing. Instead: immediate containment action, then RCPS on the root cause, with one-week escalation.
- Contradictory incentives. Why it hurts: we talk about flow but reward machine speed, and the improvement slides back. Instead: align the reward system with the strategic (OGSM) goals.
- Too many, unbalanced indicators. Why it hurts: the “track the vital few” principle is broken and the dashboard becomes unreadable. Instead: a few influenceable indicators covering the four SQDP areas.
- Unfair rewards and consequences. Why it hurts: if it is not fair and not visible, the whole system loses credibility. Instead: transparent consequences, applied in the same way to peers and superiors alike.
- Skipping capability building. Why it hurts: people are handed the board and the numbers, but have no skill for asking good questions and solving problems. Instead: planned training and coaching, with practice in asking good questions.
- Micromanagement. Why it hurts: the level loses its ownership, and the manager no longer owns their own performance. Instead: give room (empowerment) so that every level owns its own indicators.
- “The board is the goal.” Why it hurts: the board is only a small part of the system. Instead: the real goal is a working performance management system across the whole plant.
When NOT to use it? (limits of the method)
Section titled “When NOT to use it? (limits of the method)”Performance management is a strong framework, but it is not the right answer to every problem. Knowing its limits matters as much as running it:
| Situation | Why this is not (primarily) the answer | The right step | |
|---|---|---|---|
| A certified safety function is needed (emergency shutdown, protection layer) | a board and a dialogue are not a certified, audited protection | design per SIL/LOPA, IEC 61511 | |
| A one-off, non-recurring event | there is nothing to “track” durably for a single case | one-off root cause analysis, recording the lesson | |
| A complex problem with an unknown root cause | a daily dialogue will not solve a deep, systemic issue | a dedicated Six Sigma / A3 project | |
| No ownership or empowerment | imposed from above, the board stays an “information board” | first sort out roles, decision rights and consensus (OGSM) | |
| The real need is process redesign | the answer is not to measure but to change the process | VSM, [[kaizen.en | kaizen]], process redesign |
Rule of thumb: performance management is strongest for managing regular, recurring performance and for sustaining continuous improvement. For safety-critical protection and for deep, one-off problems it does not replace the appropriate tool — it complements it.
Take it home (keys)
Section titled “Take it home (keys)”- Measurement is only half the job: always turn the observation into action; plain KPI tracking is not performance management.
- Prevent, don’t correct: performance below target can no longer be repaired afterwards, so the problem has to be caught at the start of the chain.
- Tie the target to the strategy: the target on the board should match the OGSM, otherwise the front line and the strategy drift apart.
- Dialogue is the engine, consequence is the lock: without dialogue the number is dead, without consequence the dialogue is empty.
- Few, influenceable indicators: track the vital few, from the four SQDP areas, so the dashboard stays readable.
- Capability is the bottleneck: build the skill of asking good questions and solving problems through training and coaching.
Self-test
Section titled “Self-test”- What is the difference between the five elements of the MI lens and the five elements of performance management itself? Give an example of each.
- In the OGSM cascade, which two elements of the upper level become which two elements of the level below, and why does this matter for the target figures on the board?
- A panel shows a red indicator on the board. Walk through what happens in a well-functioning performance management system, from the red value to the closed solution (comment, dialogue, action, escalation).
How does this show up in digital practice?
Section titled “How does this show up in digital practice?”The principle of performance management does not stop at the physical whiteboard: the same closed loop is realized in software too. Instead of manual updating, here automatic data collection, mandatory fields and tracked actions carry the measure → dialogue → action → closure cycle; the mechanism differs, the principle is the same.
| Principle | Digital implementation | What it adds |
|---|---|---|
| Metrics and targets | KPI board / dashboard, with the target inherited from the OGSM | target–strategy alignment is handled by the system, not by manual reconciliation |
| Tracking | automatic data and downtime collection, real-time trend | the number is always current, it does not depend on manual entry |
| Visual deviation | automatic colour and alert logic for values below target | the deviation is visible immediately, it does not get lost |
| Dialogue | logged review, mandatory comment on a red indicator | the trace of the discussion and its decision stay auditable |
| Action and consequence | action tracking with owner, due date and escalation timer | an open action can be followed shift by shift, and the one-week limit is enforced by the system |
Connection to OPEREX (shift log)
Section titled “Connection to OPEREX (shift log)”The most fragile point of performance management is where the fourth and fifth elements meet: following up actions after the dialogue. The output of the performance dialogues (the deviations surfaced, the corrective and preventive actions decided with an owner and a due date, the content of the daily and weekly reviews and of the shift handover) can be logged in structured, time-stamped and auditable form in the OPEREX shift log. This way the performance management cycle (measure → dialogue → action → closure) is not broken at the shift boundary: open actions can be followed from shift to shift, and the escalation deadline (1 week) is tracked by the system. The ownership logic of the manual performance board is preserved, but the follow-up becomes a digitally closed loop.
Terminology (HU / EN / JP)
Section titled “Terminology (HU / EN / JP)”| Hungarian | English | 日本語 / note |
|---|---|---|
| teljesítménymenedzsment | performance management | the engine of MI |
| vezetési / menedzsment-infrastruktúra | Management Infrastructure (MI) | the “how we manage” lens |
| irányadás | set direction & context | elements 1–2 |
| végrehajtás és menedzselés | execute & manage performance & health | elements 3–5 |
| teljesítménytábla | performance board | the physical arena of elements 3–4 |
| teljesítménydialógus | performance dialogue | the 4th element |
| képességépítés | capability building | matching skill, need and role |
| stratégia-lebontás | OGSM / Hoshin | 方針管理 (Hoshin Kanri); the source of the What/How |
| elszámoltathatóság | accountability | clear responsibility |
What is performance management in Lean?
The closed-loop management system that aligns business goals to a shared intent, creates clear focus and accountability, and drives continuous improvement at every level through the PDCA cycle. It is the engine of the Lean Management Infrastructure (MI) lens, and the primary instrument for executing strategy and creating value.
What are the five elements of performance management?
(1) Clear metrics, targets and accountability; (2) realistic budgets and plans; (3) effective performance tracking; (4) robust performance dialogue; (5) rewards, consequences and actions.
What is the "Performance Wheel"?
That is what the source material calls the section covering the performance management model (an agenda heading). The model itself has two phases (setting direction, and execution & management) and five elements: metrics/targets/accountability, plans, tracking, dialogue, rewards/consequences/actions. The closed “Measure → Dialogue → Action” loop is what drives PDCA at every level; it is not a six-spoked wheel.
How does OGSM connect to performance management?
OGSM (Objectives–Goals–Strategies–Measures) supplies the content of the first element: the targets and the what/how breakdown. The Strategy/Measure pair of a higher level becomes the Objective/Goal pair of the level below, and the target figures on the performance board must match the numbers in the OGSM, so that the corporate vision reaches all the way down to shift level. For the full process: ogsm.
Why is it compared to a car dashboard?
Because with a few balanced indicators it shows the actual and the target value for every important indicator, and it gives the driver a correction “lever” to intervene in time, before performance falls below target — because that can no longer be corrected afterwards.
What is NOT performance management?
Merely tracking KPIs. Once a deviation has been spotted, dialogue and action must always follow; without those two there is no effective performance management. The right KPIs are, in any case, the product of the “What and How” work.
Why do Lean improvements often fail?
The tools are not at fault, performance management is: if the incentives contradict the flow and pull goals, and there is no robust dialogue and consistent action, the gain will not be sustained.
Related concepts
Section titled “Related concepts”management infrastructure · the three lenses · performance board · performance dialogue · KPI definition · KPI cascade · KPI, PI, I · feedback · capability building · functional-support · ogsm · mos · visual management · pdca · shift handover
Next step
Section titled “Next step”If you have understood this, it is worth going on from here, in this order:
- ogsm — the strategy deployment that supplies the content of the first element. Start with this, because you will understand where the target figures on the board come from.
- performance board — the physical arena of tracking and dialogue: what the board looks like and how you build it.
- performance dialogue — the fourth element in depth: the marks of a good dialogue, the question set, the 80% rule and the one-week escalation.
References / further reading
Section titled “References / further reading”- OGSM / Hoshin Kanri: strategy deployment originates in the Japanese Hoshin Kanri (方針管理) management method; the OGSM variant was made widely known by Procter & Gamble in the 1990s. The public methodological basis: Yoji Akao (ed.), Hoshin Kanri: Policy Deployment for Successful TQM, Productivity Press, 1991.
- PDCA (the Deming cycle): the closed loop of continuous improvement that performance management drives at every level; W. Edwards Deming, Out of the Crisis, MIT Press, 1986.
- Lean in the process industries: Raymond C. Floyd, Liquid Lean: Developing Lean Culture in the Process Industries, CRC Press, 2010 — the application of Lean management and performance systems in the process industries.