KPI / PI / I — the indicator hierarchy and the intervention tree
≈ 24 min read · 4,714 words
Look at a car’s dashboard. The speedometer tells you how fast you are going, but you don’t “adjust” the speedometer: you work the accelerator, the brake and the gearbox, and those move the needle. Performance management works the same way. You cannot turn the top-level, aggregated metric (the “speed”) directly; only the tangible controls beneath it. KPI / PI / I makes exactly that chain visible: it keeps breaking the important but “mute” result metric downwards until you reach the settings the front line actually holds in its hands during the shift.
KPI / PI / I is a three-level indicator hierarchy that breaks a single key metric down into the causes you can influence directly. The KPI (Key Performance Indicator) is management’s result metric: important, but it reports performance after the fact, lagging behind it. The PI (Performance Indicator) is an intermediate performance metric that drives a KPI. The I (Indicator) is the lowest, directly influenceable measure, the one the front line actually adjusts during the shift. The leaf-level I’s and the PI’s above them support the KPI from below, so every level handles the metrics it can influence. The KPI itself cannot be “set” directly; it only moves through the I’s. That is why we break it down into an intervention tree, at whose leaves the intervention actually happens.
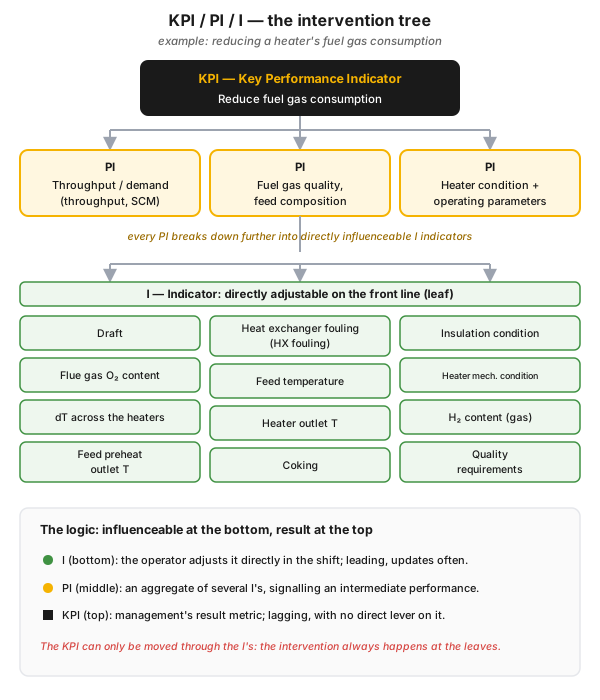
Figure 1 — the KPI/PI/I intervention tree for reducing a heater’s fuel gas consumption. At the top the KPI (the result), below it the PI’s (the intermediate drivers), and at the bottom the leaf-level I’s that the operator adjusts directly during the shift. The logic: influenceable at the bottom, result at the top, and the KPI only moves through the I’s.
Who is this for?
Section titled “Who is this for?”This article is for those who work with metrics in day-to-day performance management: operator · shift supervisor and plant manager · process engineer · energy and process engineer · reliability engineer · plant economist / controller · Lean/CI specialist · HSE.
Learning objectives
Section titled “Learning objectives”After reading this article you will be able to:
- distinguish the KPI, PI and I levels, and say who owns each one;
- explain why a KPI is lagging and an I is leading, and what that means for the timing of an intervention;
- break a result metric down, step by step, into an intervention tree that reaches the directly adjustable indicators;
- separate the KPI cascade (organizational breakdown) from the KPI/PI/I breakdown (metric decomposition);
- draw the line between where a leaf-level indicator is an energy matter and where it is safety-critical in a process-industry plant.
In brief
Section titled “In brief”- Three levels, one logic: KPI ← PI ← I. The KPI is management’s result metric; the PI is an intermediate performance metric that drives the KPI; the I is the lowest, directly influenceable indicator on the front line.
- Every level handles the metrics it can influence. The I’s and PI’s support the KPI above them; nobody is measured on something they have no leverage over.
- The KPI is lagging, the I is leading. The KPI lags and shows the result (which can no longer be corrected after the fact); the I looks forward, and that is where the operator intervenes in time, before the KPI falls below target.
- The intervention tree is a cause-and-effect breakdown: we keep splitting the KPI into PI’s and then into I’s until we reach the control variables that can actually be adjusted during the shift (the “leaves” of the tree).
- The intervention always happens at the leaves. A KPI cannot be “turned” directly; it only moves through the I’s beneath it (fuel gas consumption, for example, moves through flue gas O₂, draft and heat exchanger cleanliness).
- Sound KPIs are the product of the What & How work. A KPI is not arbitrary: it follows from the What (objective) and How (strategy/measure) breakdown of OGSM, so that every level has its own relevant metric.
- Marks of a good KPI: simple and measurable, actionable (there is leverage on it), significant in impact, typically non-financial, and often leading. The targets are SMART.
Why does it matter? (the stakes)
Section titled “Why does it matter? (the stakes)”The biggest stake in metrics is timing. A KPI is lagging by its very nature: by the time the deviation shows up, the result has already been produced and cannot be corrected retrospectively. If the organization only stares at the top-level KPI, it will always be arguing about yesterday’s performance while today’s shift settings are drifting away again.
Measuring alone is therefore not enough. One of the founding statements of performance management is that performance which has slipped below target cannot be “put back” afterwards: trouble has to be prevented before it happens. That, however, requires a metric you can act on in time, meaning a leading, directly influenceable I indicator on the front line. The KPI/PI/I breakdown delivers exactly that: it translates the slow, aggregated result into fast-moving measures the operator can correct mid-shift.
The stakes are tangible: with a badly chosen metric, or one measured too high up, the organization intervenes too late and at the wrong level, losing energy, yield and sometimes safety margin, all while it was “measuring” throughout. With a well-built tree, the same deviation is fixed while the shift is still running, cheaply and in the right hands.
What are the KPI, the PI and the I? — the three levels
Section titled “What are the KPI, the PI and the I? — the three levels”The first element of performance management (performance management) is “clear metrics, targets and accountability”, but how do we know which metric is the right one at a given level? The answer is the indicator hierarchy: not all measures are equal, and they are not all owned by the same level.
KPI — Key Performance Indicator. The most important, high-level metric from the organization’s point of view, typically the result metric of the management level. A good KPI is simple and easy to measure, actionable (there is leverage on it), has a significant impact on the organization, is typically non-financial in character, and is often leading (“forward-looking”). By its nature, though, a KPI is still frequently lagging (it reports the result after the fact), which is precisely why looking at it is not enough: you also have to be able to intervene while there is still time. Its associated targets are SMART (Specific, Measurable, Achievable, Results-oriented, Time-bound).
PI — Performance Indicator. An intermediate, aggregated metric that drives one KPI. The PI is not the end result but a link in the chain: several low-level indicators add up into it, and it in turn feeds the KPI above it. The PI is typically the metric of the asset team / block level.
I — Indicator. The lowest, operational, directly influenceable measure, the one the front line actually adjusts during the shift. An I refreshes frequently (process and energy parameters even hourly), makes the gap to target easy to see, and is relevant to the process. This is the level where the hand is on the “correction lever”.
How do the I’s and PI’s support the KPI?
Section titled “How do the I’s and PI’s support the KPI?”The point of the hierarchy is not the order of the letters but the supporting logic: the lower levels serve the one above them. The KPI sits at the top, but on its own it is a “mute” metric with no direct lever on it. For it to move, the PI’s beneath it have to move; and for a PI to move, the leaf-level I’s have to be adjusted.
You can read this logic in two directions:
- Top-down (breakdown): starting from the KPI you ask, “what drives this?”, and that takes you to the PI’s and then to the I’s. This is how the intervention tree is built.
- Bottom-up (aggregation): the values of the I’s accumulate into the PI’s, and the PI’s into the KPI. This upward-running chain is what the level-by-level cascade of the performance board shows.
The practical consequence is strong: everyone is measured on their own influenceable metric. We do not ask the operator “why did the plant’s specific energy consumption go up?” (they have no direct leverage over that), but whether the flue gas O₂ content and draft of their own heater are on target. The founding principle of energy-oriented performance management is that at any given level the metric should be the indicator over which the employee has real leverage, such as the heater’s energy consumption or the oxygen content of the flue gas for an operator.
How does the KPI cascade differ from the KPI/PI/I breakdown?
Section titled “How does the KPI cascade differ from the KPI/PI/I breakdown?”In short: the KPI cascade distributes the target among people and levels, while the KPI/PI/I breakdown takes one metric apart into its influenceable causes. They are related but not the same, and conflating them is one of the most common mistakes.
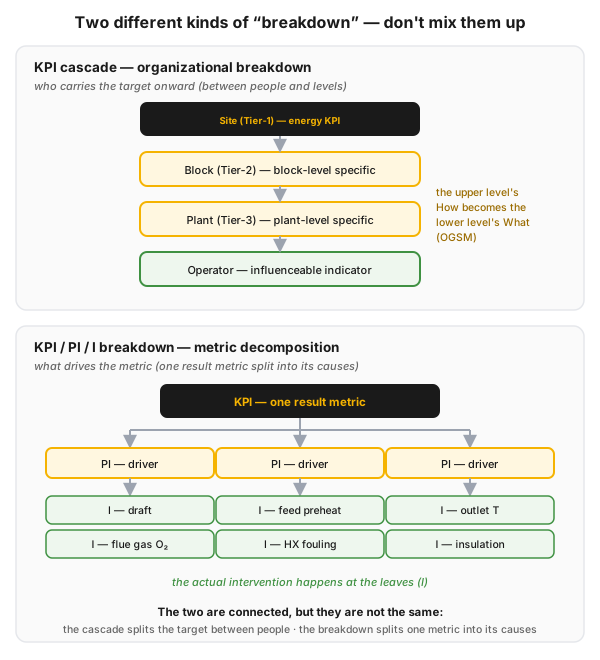
Figure 2 — the two kinds of “breakdown” side by side. Above, the KPI cascade: it passes the same (or a similar) metric on from level to level, where the upper level’s How becomes the lower level’s What (OGSM logic). Below, the KPI/PI/I breakdown: the metric decomposition of a single result metric into its drivers, where the intervention happens at the leaves.
The KPI cascade is an organizational breakdown: it carries the strategic objective down the organizational tree, where the upper level’s How (strategy and measure) becomes the lower level’s What (objective and expectation), see OGSM. The KPI/PI/I breakdown, by contrast, is a metric decomposition: it does not divide the target between people but takes a result metric apart into its causes. The two are of course connected, and the levels of the metric tree typically map onto the organizational levels as well, but their questions differ: the cascade asks “who carries it onward?”, the breakdown asks “what drives it?”.
What is the intervention tree, and how do you break a KPI down?
Section titled “What is the intervention tree, and how do you break a KPI down?”The intervention tree (also called a driver tree) is the structured breakdown that splits a KPI into intermediate PI’s and then into directly influenceable I’s, until you reach the control variables that can actually be adjusted during the shift. The classic textbook example is reducing a heater’s fuel gas consumption, an energy KPI directly linked to the plant’s specific energy consumption and therefore to the bottom line.
The KPI at the top: reduce fuel gas consumption. We break it down into the following drivers (PI’s):
- Throughput and demand: the quantity processed (throughput) and the demand arriving from the supply chain (SCM). The more you push through, the more heat you have to put in.
- Fuel gas quality and feed composition: the calorific value and H₂ content of the gas, together with the composition of the feedstock, determine how much gas is needed for the same heat and which quality requirements have to be met.
- Heater condition and operating parameters: the mechanical condition (insulation, coking) and the adjustable operating parameters together decide the heater’s efficiency.
The third PI breaks down the most richly into leaf-level I indicators, the ones the operator adjusts or watches during the shift:
- Draft: the heater’s air-side setting.
- Flue gas O₂ content: the measure of excess air; too much air is wasted heat loss, too little means incomplete combustion.
- dT across the heaters: the temperature difference measured across the heaters.
- Feed preheat outlet temperature and feed temperature: the hotter the feed arrives, the less gas has to be burned.
- Heat exchanger fouling (HX fouling): a fouled exchanger preheats less effectively, so fuel gas demand rises.
- Heater outlet temperature and coking: the process and condition parameters.
- Insulation and the heater’s mechanical condition: the “static” factors that determine heat loss.
- H₂ content (gas quality) and the quality requirements: the constraints on the fuel gas side and on the product side.
How to read the tree: the KPI at the top (a lagging result) can only be reduced if the operator keeps the leaf-level I’s on their targets, for example by optimizing the flue gas O₂, raising the feed preheat and managing heat exchanger fouling. The intervention always happens at the leaves.
How do you build the tree step by step?
Section titled “How do you build the tree step by step?”The tree is not drawn from memory; it is built up by energy type and by unit, driven by data. The steps of diagnostic practice:
- Choose the main KPI for the energy type in question (specific energy consumption per unit, for example).
- Identify the main consuming equipment for that energy type (which heater, compressor or stripper accounts for most of the consumption).
- Break the KPI into intermediate PI’s (throughput, quality, equipment condition, operating parameters).
- Take it down to the directly adjustable I’s, all the way to the parameters the panel operator holds in hand.
- Estimate in percentage terms how much of the consumption each piece of equipment or variable explains, so that the tree highlights the vital few.
- Derive the targeted analyses and tests from the tree (what is worth measuring, where the largest reserve lies).
The variables that appear at leaf level are often relevant to energy and safety at the same time. At a sour water stripper, for instance, the steam-to-feed ratio, the pH of the treated water, the H₂S content and the flash point are all such variables: the tree points to the same settings from a consumption and from a safety perspective alike.
How do you keep an indicator on target?
Section titled “How do you keep an indicator on target?”Once an I has been identified, three steps keep it on target:
- Find its optimum target value: the setting that is best from the KPI’s point of view (the optimum O₂ level of the flue gas, for example).
- Standardize: write an SOP for the work tied to the indicator, so that the good setting is repeatable from shift to shift.
- Track it on the board: on the whiteboard of the performance board, by hand, with a target value and colour coding.
Process-industry context and safety
Section titled “Process-industry context and safety”In a process-industry plant, the KPI/PI/I breakdown is the primary tool for holding specific energy consumption [GJ/t] under control. The site-level energy KPI breaks down into blocks (distillation, motor fuel production, reformer), then to plant and equipment level, all the way to the parameters the panel operator can set (heater draft, flue gas O₂, feed preheat). Different tools suit different levels for tracking: at business/asset level, plan-versus-actual reporting and energy/yield tools; at operational level, the whiteboard and the DCS screen. Each displays the metrics of its own level, with target values.
An important boundary: the KPI/PI/I breakdown is a performance-management tool, not a protection layer. The fact that a safety-critical parameter (flash point or H₂S, for example) appears as a leaf indicator in the tree does not change the requirement that the certified protective function be designed according to risk analysis and the relevant standards (LOPA / SIL, IEC 61511). The tree helps you see and hold on target; it does not substitute for a safety interlock.
Putting it into practice (mini-scenario)
Section titled “Putting it into practice (mini-scenario)”Here is how a shift supervisor would introduce this tomorrow, on a single KPI:
- Pick the one KPI your team can genuinely move (the fuel gas consumption or specific energy of your own heater, for example).
- Draw the tree on a flip chart with the team: break it into PI’s with the question “what drives this?”, then keep asking until you reach the I’s that can be adjusted during the shift (draft, flue gas O₂, preheat).
- Mark the 3-5 significant leaves with the largest content, and give each of them a target value.
- Put them on the performance board with target values and colour coding, and tie them into the per-shift dialogue: on a deviation, an owner plus a deadline.
- Standardize the good setting in an SOP, so that it does not depend on who is on shift.
The practical rule of thumb: if the tree stops at the PI’s, there is still nothing to grab hold of. Keep asking until every branch reaches a metric that someone in the shift can actually turn.
Measurement and audit
Section titled “Measurement and audit”The KPI/PI/I breakdown only solves the what do we measure question; measurement on its own is not enough, the deviation has to be turned into action. A few handholds for making metrics auditable:
- The vital few. We keep a balanced set of metrics rather than a large one; superfluous indicators are deleted so that the tree stays readable and the board stays scannable.
- A target value at every level. Every metric should have a clear, appropriate target value, and the board should show both the current and the target value, with colour coding.
- Coverage. Every critical energy consumer and safety-critical point should have a leaf indicator and an SOP: an auditable list of what we are holding on target.
- Visual management. Metrics are displayed so that a deviation shows at a glance; that is precisely what visual management is, anyone recognizing the standard and any departure from it immediately.
Common mistakes
Section titled “Common mistakes”- Measuring everyone on the KPI. Holding an operator to account for site-level specific energy consumption is pointless, because they have no direct leverage over it. Instead: track an I on the front line, not a KPI.
- Not taking the tree down to leaf level. If the breakdown stops at the PI’s there is nothing to grab hold of: the directly adjustable control variable is missing, so the KPI stays “mute”. Instead: take every branch down to an indicator adjustable during the shift.
- Confusing the lagging KPI with the leading I. Staring at the KPI is futile once the result has already been produced. Instead: prevention happens on the leading I’s, in time.
- Too many indicators. The “track the vital few” principle is violated; the tree becomes unreadable and the board crowded. Instead: delete the superfluous metrics and keep a balanced set.
- An arbitrary KPI. If the metric does not come from the OGSM What/How work, it is connected neither to the strategy nor to the influenceable causes. Instead: let the KPI emerge as the product of the What & How.
- Measuring without dialogue and action. The breakdown only solves the what do we measure question; after a deviation, a dialogue and an action tied to an owner and a deadline are mandatory. Instead: always turn measurement into action (see performance management).
- Blurring the KPI cascade and the KPI/PI/I breakdown. Instead: keep the organizational breakdown (who carries the target onward) apart from the metric decomposition (what drives the metric).
When NOT to use it? (limits of the method)
Section titled “When NOT to use it? (limits of the method)”The intervention tree is strong for holding continuous, recurring performance under control, but it is not the right tool for every problem:
| Situation | Why the KPI/PI/I tree is not (primarily) the answer | The right answer |
|---|---|---|
| A one-off, non-recurring deviation | the tree is for regular, measurable performance, not for a single event | one-off root cause analysis, A3, recording the lesson |
| The root cause is unknown or complex | the tree organizes the drivers, it does not uncover an unknown cause | 5 Whys / DMAIC for the root cause, then a metric |
| A certified safety function is required | a leaf indicator is not a protection layer | design per SIL/LOPA, IEC 61511 |
| There is no real leverage over the metric at that level | a metric placed at the wrong level demotivates and misdirects | put the metric at the level where it is influenceable |
| The target does not come from strategy | an arbitrary KPI, weakly connected to the real priority | OGSM What/How first, and the metric out of that |
Rule of thumb: the KPI/PI/I tree is strongest for recurring, measurable, influenceable performance. For an unknown root cause and for certified safety protection it does not replace the appropriate tool, it complements it.
Take it home (keys)
Section titled “Take it home (keys)”- The KPI is mute, the I is the lever. You do not set the top-level result metric directly; find the indicator beneath it that can be turned during the shift.
- Measure everyone on the metric they can influence. An I for the operator, a PI for the block, a KPI for management, never the other way round.
- The tree lives at the leaves. If the breakdown stops at the PI’s there is nothing to grab hold of; take it down to the panel operator’s parameter.
- Holding on target in three steps: optimum target value → SOP → board with target value and colour coding.
- The leaf is often safety-critical (pH, H₂S, flash point): the tree makes it visible, but it does not substitute for certified protection.
- Don’t mix it up with the cascade: the cascade divides the target among people, the breakdown takes one metric apart into its causes.
Self-test
Section titled “Self-test”- Why can a lagging KPI not be “set” directly, and where does the operator intervene instead?
- Take an energy or yield KPI from your own area and break it down into at least two PI’s and four I’s adjustable during the shift. Which leaf holds the largest reserve?
- State in one sentence the difference between the KPI cascade and the KPI/PI/I breakdown, and give an example of each.
How does this show up in digital practice?
Section titled “How does this show up in digital practice?”The principle of the indicator hierarchy does not stop at the whiteboard: the same logic is realized in software too. Instead of the hand-written board, automatically collected data, level-by-level views and target-linked alerting carry the metrics here; the mechanism differs, the principle is the same.
| KPI/PI/I principle | Digital implementation | What it delivers |
|---|---|---|
| A metric per level (KPI / PI / I) | role-based dashboard view: everyone sees their own level | everyone works on the metric they can influence |
| Tracking leaf-level I’s | automatic, timestamped recording of the operational parameters | the trace of the intervention survives, it is not lost with the shift |
| Target value + deviation | target-linked colour coding and alerting | the deviation shows immediately, while it can still be corrected in time |
| Aggregation upwards | the I’s roll up automatically into PI’s, PI’s into KPIs | the upper level sees a real, substantiated number |
| Standardized holding on target | a digital SOP / checklist tied to the indicator | the good setting is repeatable regardless of shift |
| Measurement → action | a task tied to the deviation, with an owner and a deadline | measurement necessarily becomes action, not just a number |
Connection to OPEREX (shift log)
Section titled “Connection to OPEREX (shift log)”The lowest, influenceable I indicators of the intervention tree, the flue gas O₂ content, the draft, the heater outlet temperature, the feed preheat, the steam-to-feed ratio or the pH of the treated water, are precisely the data that are measured and adjusted hourly during the shift. Their per-shift values and deviations from target can be recorded in the OPEREX shift log with a timestamp, retrievably and auditably. The tree then does not stay a static diagram: the I-level settings give a data base for the tracking row of the performance board, and a KPI deviation becomes traceable back to the specific operator intervention. From the strategic metric (KPI) to a single adjustment made during the shift (I), a closed, cause-and-effect trail is created that makes fact-based argument possible in the performance dialogue.
Terminology (HU / EN / JP)
Section titled “Terminology (HU / EN / JP)”| Hungarian | English | Note |
|---|---|---|
| kulcs teljesítménymutató | KPI — Key Performance Indicator | management level, result, often lagging |
| teljesítménymutató | PI — Performance Indicator | intermediate, drives one KPI |
| indikátor | I — Indicator | lowest level, directly influenceable |
| kulcs operatív mutató | KOI — Key Operation Indicator | in some systems, the operational team’s equivalent of a KPI |
| operatív mutató | OI — Operation Indicator | in some systems, the operational team’s equivalent of an I/PI |
| beavatkozási fa / hajtóerő-fa | intervention tree / driver tree | the cause-and-effect breakdown of a KPI |
| előretekintő mutató | leading indicator | suitable for prevention |
| utólagos / lemaradó mutató | lagging indicator | shows the result |
| stratégia-lebontás | OGSM / Hoshin (方針) | the source of the What/How |
| füstgáz oxigéntartalma | flue gas O₂ content | a typical leaf-level I |
What is the difference between a KPI, a PI and an I?
The KPI (Key Performance Indicator) is the most important, high-level result metric from the organization’s point of view, typically at management level. The PI (Performance Indicator) is an intermediate performance metric that drives a KPI. The I (Indicator) is the lowest, operational, directly influenceable measure, the one the front line actually adjusts during the shift. The I’s and PI’s support the KPI above them from below.
What is the intervention tree?
A structured, cause-and-effect breakdown that splits a KPI into intermediate PI’s and then into directly influenceable I’s, until you reach the control variables that can actually be adjusted during the shift. Example: the fuel gas consumption KPI breaks down into the indicators of draft, flue gas O₂ content, feed preheat and heat exchanger fouling, and those are where the operator intervenes.
Why can't a KPI be "set" directly?
Because a KPI is typically a lagging result metric: it is the outcome we measure afterwards, not a lever we can turn. It only moves through the leading I indicators beneath it. That is why we break it into a tree: the intervention always happens at the leaf-level I’s, in time, before the KPI falls below target.
What is the difference between the KPI/PI/I breakdown and the KPI cascade?
The KPI cascade is an organizational breakdown: it passes the target on between people and levels (the upper level’s How becomes the lower level’s What, OGSM logic). The KPI/PI/I breakdown, by contrast, is the metric decomposition of a single KPI into its drivers; it does not divide the target between people but takes a result metric apart into its causes.
How can a lower-level indicator be kept on its target value?
In three steps: (1) find its optimum target value; (2) standardize it by writing an SOP, so that the good setting is repeatable from shift to shift; (3) track it on the whiteboard of the performance board, by hand, with a target value and colour coding.
What makes a KPI good?
It is simple and easy to measure, actionable (there is leverage on it), significant in its impact on the organization, typically non-financial in character, and often leading, that is, forward-looking. Its associated targets are SMART: specific, measurable, achievable, results-oriented and time-bound.
Related concepts
Section titled “Related concepts”KPI definition · KPI cascade · performance management · performance board · performance dialogue · ogsm · visual management · standard work · pdca
Next step
Section titled “Next step”If you have understood this, from here it is worth going on, in this order:
- KPI definition — what makes a KPI good: the marks and the SMART targets in detail, before you build a tree.
- performance board — where the metrics end up: the board on which the tree’s I’s live with target values and colour coding.
- performance dialogue — what happens to the deviation: this is where measurement turns into an action tied to an owner and a deadline.
References / further reading
Section titled “References / further reading”- Robert S. Kaplan – David P. Norton: The Balanced Scorecard. Harvard Business Review Press, 1996 — the canonical foundational work on leading versus lagging metrics and the link between strategy and measures.
- George T. Doran: There’s a S.M.A.R.T. way to write management’s goals and objectives. Management Review, 1981 — the original source of SMART goal setting.
- Raymond C. Floyd: Liquid Lean: Developing Lean Culture in the Process Industries. CRC Press, 2010 — the application of performance metrics in the process industries.