KPI — the definition of the key performance indicator and the marks of a good one
≈ 22 min read · 4,413 words
Look at a car’s dashboard: you don’t see every parameter of the engine, only the handful that matter while you drive, and that you can actually respond to. Speed, fuel level, coolant temperature: few, clearly visible indicators, each with a “lever” attached to it (the accelerator, a stop at the pump). This is exactly the logic of the KPI. KPI stands for Key Performance Indicator: out of all the numbers you could measure, the few that meaningfully drive the organization’s performance, and that the person looking at them can actually act on. Let’s look at what it is, what makes a KPI good, and how to choose one well.
A KPI (key performance indicator) is a simple, measurable and influenceable key metric that meaningfully drives the performance of the organization. It is typically non-financial in nature and often forward-looking (leading). Its target is SMART: Specific, Measurable, Attainable/Achievable, Realistic/Results-oriented and Time-bound. A good KPI is not an arbitrary pick but the product of the “What & How” work of strategy deployment, and part of a small, balanced, “vital few” set of indicators.
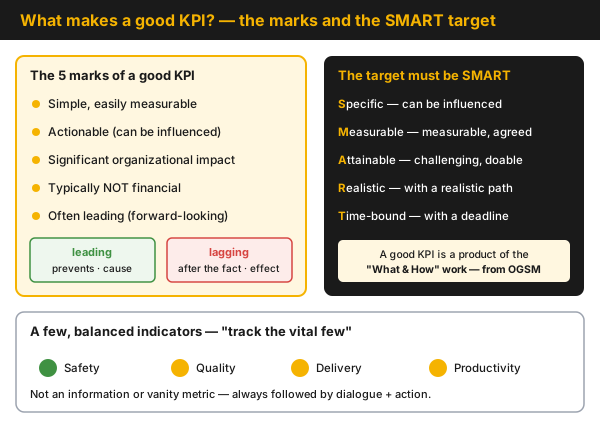
Figure 1 — the five marks of a good KPI and the leading/lagging distinction (left), the SMART target criteria (right), and the principle of the “few, balanced set” (bottom strip). A good KPI always comes paired with dialogue and action; it is never an information metric or a vanity metric.
Who is this for?
Section titled “Who is this for?”This article is for those who choose, measure or explain indicators in day-to-day operations: shift supervisor and plant manager · process engineer · process and reliability engineer · maintenance manager · HSE specialist · Lean/CI lead · asset team and management.
Learning objectives
Section titled “Learning objectives”After reading this article you will be able to:
- list the five marks of a good KPI, and decide about any given metric whether it is a KPI or merely information;
- distinguish leading from lagging indicators, and explain why the two work best as a pair;
- set a SMART target, and recognize when one of the letters is violated;
- explain why a good KPI comes from the “What & How” work of OGSM rather than from free association;
- draw the line: when a KPI is NOT the right tool.
In brief
Section titled “In brief”- KPI = Key Performance Indicator: a key metric that is simple and easily measurable, actionable, of significant organizational impact, typically non-financial, and often leading (forward-looking). These five marks are the filter.
- The target is SMART: Specific · Measurable · Attainable/Achievable · Realistic/Results-oriented · Time-bound. The team can influence it, the way it is measured is agreed, the target is challenging yet attainable and realistic, and it is tied to a deadline.
- Good KPIs are products of the “What & How” work: they are not randomly picked numbers but are derived from OGSM strategy deployment (Objective/Goal = what; Strategy/Measure = how). The target values on the board must match the numbers in the OGSM.
- You need a small and balanced set: “track the vital few.” Typically a handful of indicators per level, covering the main dimensions (safety, quality, delivery, productivity, people), not every number that can be measured.
- Leading vs. lagging: a leading indicator measures the cause and allows a preventive intervention before the trouble arrives; a lagging indicator measures the effect, which can no longer be corrected after the fact. A good program pairs the two.
- A KPI on its own is not performance management. Once a deviation is spotted, dialogue and action must always follow. “Own your numbers” is worth something only if action comes after it.
- What this article does not cover: the vertical KPI cascade between OGSM levels and the KPI → PI → I indicator breakdown are covered in separate articles. The focus here is the concept itself and the marks of a good KPI.
Why does it matter? (the stakes)
Section titled “Why does it matter? (the stakes)”A badly chosen KPI costs more than it helps, because an organization optimizes for whatever it is measured on. If the indicator cannot be influenced, it demotivates and leads to people passing responsibility along. If it focuses on only one dimension (say, productivity alone), the system becomes distorted: the classic trap is when “we talk about flow but still reward machine speed.” And if the indicator is lagging, the frontline always meets the problem after the fact, when nothing can be corrected any more.
So the stakes are not whether to measure at all, but whether we measure the right few things, at the right level, in time. A well-chosen, influenceable, leading set of KPIs directs the organization’s attention to where the decision is still cheap. A bad set squanders that same attention: on too many indicators, on vanity numbers, or on after-the-fact results nobody can change any more.
What is it, and where does it come from?
Section titled “What is it, and where does it come from?”The KPI is the concrete embodiment of the first building block of performance management: the principle of “clear metrics, targets and accountability.” In the method’s “car dashboard” analogy, the KPI is the performance indicator whose actual and target values are shown side by side, and which has a corrective “lever” attached to it. This is why we speak not merely of an “indicator” but of a key performance indicator: out of all the possible numbers we single out the ones that meaningfully drive the organization’s performance.
The approach comes from the practice of Lean and performance management, where the purpose of measurement is not reporting but action: the indicator exists so that when a deviation appears, we know what to do. This is a sharp break from traditional “reports written by outsiders” and from “setting arbitrary improvement targets,” where the number is an end in itself. A good KPI always belongs to a decision.
What is a KPI, and what are the marks of a good one?
Section titled “What is a KPI, and what are the marks of a good one?”A good KPI can be described by five marks. By the defining logic, a KPI:
- Is simple and easily measurable (is simple, easily measurable). If measuring an indicator is complicated, contested or expensive, it will never become a KPI used day to day.
- Is actionable (is actionable). The person looking at it can influence it: they know what to do when it drifts from target. This is the mark most often violated. On the frontline you need an indicator the shift can actually move.
- Has a significant effect on the organization (has a significant effect on the organization). Not everything measurable is important; a KPI measures the vital few.
- Is typically non-financial in nature (is not financial in nature). A financial figure is a delayed, after-the-fact result; a good operational KPI measures the driver of the process (availability, specific energy consumption, cycle time, for example), which can be influenced in time.
- Is often leading, forward-looking (is often leading or “forward-looking”). It measures the cause that shapes the future result, and so allows a preventive intervention.
One important emphasis: results and successes should be celebrated together with the team (results/success celebrated with the team). A KPI is not an instrument of punishment but a shared point of focus.
What is NOT a good KPI?
Section titled “What is NOT a good KPI?”Anything that violates the five marks above. An indicator that lists every measurable parameter, or that the person looking at it cannot influence, is not a KPI but information or a vanity metric: it looks good but leads to no action. This is precisely why a performance board is not an information board: a KPI has to trigger action, not merely convey data.
The chosen KPI set has to be small and balanced. The underlying principle is that you need “not too many and a balanced set of indicators”, which is the Lean principle of “track the vital few.” Balance means that together the indicators cover the main performance dimensions. Five recurring KPI categories emerge, each with examples:
| Category | Example KPI |
|---|---|
| Quality and risk | off-spec rate (%), reblend rate (%) |
| People | employee satisfaction, training hours per person per year |
| Customer satisfaction | order-to-delivery lead time |
| Continuous improvement | number of implemented ideas, return on investment (ROI) |
| Productivity | tonnes/hour vs. plan, availability, OEE |
Concentrate on only one of these dimensions and the system becomes distorted; that is the classic trap of performance management.
Leading vs. lagging — measuring cause and effect
Section titled “Leading vs. lagging — measuring cause and effect”One of the most important properties of a KPI is whether it is leading (forward-looking) or lagging (after the fact). A leading indicator measures the cause before the consequence sets in; a lagging one measures a result that has already happened.
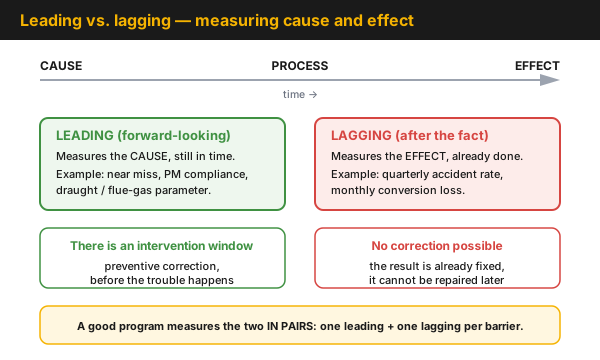
Figure 2 — the leading indicator sits at the front of the process and measures the CAUSE, so an intervention window remains for a preventive correction; the lagging indicator measures the EFFECT, which can no longer be changed. A good program applies the two as a pair.
- A lagging indicator measures a result that has already happened (a quarterly accident rate or a monthly conversion loss, for example). It tells the truth, but it can no longer be corrected: below-target performance cannot be fixed retrospectively, so the problem has to be prevented.
- A leading indicator measures the cause that shapes the future result (the number of near misses, preventive-maintenance compliance, or the draught or flue-gas parameter of a piece of equipment, for example). This allows a preventive intervention before the end result goes wrong.
This is why the mark reads that a good KPI is often leading: on the frontline, a causal, influenceable indicator is more useful than a delayed financial result. The process safety literature (OGP Report No. 456) confirms the same point: higher, outcome-level indicators tend to be lagging, lower, barrier-level ones tend to be leading, and the best programs apply the two as a pair, assigning one leading and one lagging indicator to the same barrier.
Process-industry OGSM practice maps this pair explicitly: Goals = Lagging KPIs (what we want to achieve, in numbers), Measures = Leading KPIs (how, through which initiatives and their measurement). The “what” takes shape in words (Objective) and in numbers (Goal); the “how” in initiatives (Strategy) and in their measure (Measure).
What makes a good target? — SMART
Section titled “What makes a good target? — SMART”A KPI is not complete without its target value. For target setting, the SMART framework gives the recipe (the acronym is spelled out in two ways in practice, and both are given here):
- S — Specific: the owning team of the performance board can influence it. The target should be set at the level that is able to move it.
- M — Measurable: it can be measured, and the way it is measured is accepted and agreed within the team. If the measurement method is contested, the dialogue will be about methodology instead of performance.
- A — Attainable / Achievable: it is challenging yet deliverable. A trivially easy target and an impossible one both undermine credibility.
- R — Realistic / Results-oriented: the team considers the target realistic, including the actions that lead to it.
- T — Time-bound: there is a given deadline for carrying out the action that leads to the target.
Targets are set both top-down and bottom-up, with internal and external benchmarking, and in a way that keeps them challenging, because that is what drives continuous performance improvement. A key principle: the target figures on the board have to match the numbers in the OGSM, otherwise the frontline and the strategy drift apart.
Why is a good KPI a product of the “What & How” work?
Section titled “Why is a good KPI a product of the “What & How” work?”Because a KPI is not free association or a collection of “nice numbers” but the output of strategy deployment. The two halves of the OGSM logic tell you what to measure and with what:
- the What is the Objective (the goal, in words) and the Goal (the numerical target): this gives you what you measure;
- the How is the Strategy (the initiative) and the Measure (its metric): this gives you which indicator you use to track execution.
So the KPI derives from the OGSM. Mapping that vertically (how one level’s “How” becomes the “What” of the level below, and how KPIs are broken down into PIs and Is) is the subject of the related articles: the derivation between levels is the KPI cascade, and the causal breakdown of an indicator into an indicator tree is covered in KPI → PI → I.
Process-industry context and safety
Section titled “Process-industry context and safety”In the process industries, KPI selection is directly about what can be influenced. Specific energy consumption [GJ/t], operational availability (%), throughput [t/day], the number of unplanned shutdowns or conversion loss are all classic, non-financial, actionable KPIs that the panel operator and the shift can affect directly. The lower-level leading indicators underpinning them typically refresh hourly (process and energy parameters), while maintenance and logistics indicators refresh per order.
Balance in the selection is critical here: a process-industry OGSM typically covers HSE (personal and process safety, environment), quality (complaints), delivery and reliability (OA), cost and energy (specific energy consumption, maintenance cost) and the human dimension. KPIs are selected level by level (site → business team → asset team → plant/equipment), and each level works with the indicators it can itself influence.
Internal, specific process-industry target figures (given GJ/t or OA targets, organization-specific KPI codes and maintenance registers) are confidential: in web material they are treated as general examples and anonymized, never as benchmarks.
Putting it into practice (roadmap)
Section titled “Putting it into practice (roadmap)”A good set of focus KPIs is not born all at once but works its way down from the strategy. The established sequence:
- Derive it from the strategy. Start from the “What & How” work of OGSM: the Objective/Goal gives you what you measure, the Strategy/Measure gives you with what. Do not work upwards from the numbers that happen to be measurable.
- Select the focus KPIs. A handful per level, in a balanced set (safety, quality, delivery, productivity, people). Filter against the five marks: is it influenceable, is it significant, is it non-financial, is it leading?
- Set a SMART target. Top-down and bottom-up, with internal and external benchmarking, challenging but realistic. Check that the target figure matches the numbers in the OGSM.
- Cascade it through the organization. Place the PIs and Is that drive the KPI underneath it, so that every level has an indicator it can itself influence. A high-level KPI is the aggregate of the indicators below it.
- Make it visible and close the loop. Put it on a visual board, hold the performance dialogue, and assign an action and an owner to every deviation. Refine the set with the PDCA cycle.
Hands-on / mini-scenario
Section titled “Hands-on / mini-scenario”Here is how you would put together a shift-level KPI board tomorrow. Take a plant and ask: what are the few things this shift can influence that meaningfully drive performance? Pick one from each of the main dimensions, for example: near-miss reporting (safety, leading), off-spec rate (quality), throughput vs. plan (productivity), specific energy consumption (cost, leading). Write a SMART target for each: measurable, with an agreed measurement method, challenging but realistic, with a deadline. Check that the targets match the OGSM. That comes to five or six indicators at most, it fits on a single board, and every line has a “what we do if it goes red” action attached to it.
Homework. Take an existing performance board in your own area and ask of every indicator: (a) can the person looking at it influence it? (b) is it leading or lagging? (c) is it information or a KPI? Anything that fails the first question should either be moved to a lower level or replaced with an influenceable, leading indicator.
Measurement and audit
Section titled “Measurement and audit”The quality of a KPI set can itself be audited. Useful check questions:
- Influenceability: can the person looking at each indicator influence it? (This is the most common failure.)
- Balance: do they together cover the main dimensions, or are they one-sided (productivity only)?
- Leading share: are there enough leading, preventive indicators, or is almost everything lagging?
- OGSM fit: do the target figures match the strategic (OGSM) numbers?
- Action linkage: does every red deviation have a documented comment, an action and an owner?
- Refresh frequency: is the indicator measured as often as the decision requires (I: hourly; PI: daily/weekly; KPI: monthly)?
The aim is not the number of indicators but that the vital few are measured well, in time and at an influenceable level, tied to action.
Common mistakes
Section titled “Common mistakes”- Too many indicators. A violation of “track the vital few”: an unreadable dashboard and fragmented attention. Instead: a handful per level, in a balanced set.
- A financial or lagging indicator on the frontline. A delayed, after-the-fact number does not allow timely intervention. Instead: at the operational level, the causal, leading indicator is the useful one.
- A KPI that cannot be influenced. If the person looking at it has no leverage over it (violating Specific/actionability), the indicator demotivates and leads to responsibility being passed along. Instead: put the indicator at the level that can move it.
- A vanity or information metric. A pretty number that leads to no action. Instead: a KPI is not board decoration; it has to trigger dialogue and action.
- A contested measurement method. If the way it is measured is not agreed (violating Measurable), the meeting will be about methodology instead of performance. Instead: agree on the measurement method first, then set the target.
- A trivial or impossible target. A violation of “A” and “R”: too easy a target drives no improvement, an impossible one undermines credibility. Instead: a challenging but realistic target, backed by a benchmark.
- A KPI cut loose from the OGSM. If the target figures on the board do not match the OGSM, the frontline and the strategy drift apart. Instead: derive the KPI from the “What & How” work.
- “Just tracking” the KPI. Without dialogue and action it is not performance management. Instead: always turn the measurement into action.
When NOT to use it? (limits of the method)
Section titled “When NOT to use it? (limits of the method)”KPI-based performance measurement is powerful, but it is not for every situation. Knowing this matters just as much as knowing the method itself:
| Situation | Why a KPI is not (primarily) the answer | The right answer |
|---|---|---|
| A one-off, non-recurring problem | there is no durable process to hold in hand through measurement | ad-hoc problem solving, root cause analysis |
| The target cannot be influenced at that level | a non-actionable indicator demotivates and leads to no action | put the indicator at the level that can move it; here, display it as information only |
| A certified safety function is needed | a KPI is measurement and attention, not a protection layer | SIL/LOPA, protection designed to IEC 61511 |
| Measurement damages behaviour (perverse incentive) | a one-sided or manipulable indicator drives the wrong optimization | a balanced set + keeping the intent behind the measurement alive in dialogue |
| The indicator is contested or unreliable to measure | a KPI built on bad data is worse than none | measurement capability and agreement first, target setting afterwards |
Rule of thumb: the KPI is strongest for holding recurring, influenceable performance that can be derived from the strategy in hand. For a one-off problem, certified safety or unreliable measurement it does not replace the appropriate tool.
Take it home (keys)
Section titled “Take it home (keys)”- Few, influenceable, balanced. A good KPI board measures the vital few, every indicator can be influenced, and together they cover the main dimensions.
- Leading > lagging on the frontline. An indicator that measures the cause and prevents is more useful than a delayed result; best of all, measure the two as a pair.
- No KPI without a SMART target. A measurable, agreed, challenging yet realistic, deadline-bound target value is what makes an indicator usable.
- The KPI comes from the strategy. It is the product of the “What & How” (OGSM) work; the target figures on the board should match the numbers in the OGSM.
- Measuring on its own is not management. Every deviation needs dialogue, an action and an owner, otherwise the KPI is just decoration.
Self-test
Section titled “Self-test”- List the five marks of a good KPI, and give an example of an indicator that is not a KPI (and say which mark it violates).
- Give one leading and one lagging indicator for the same barrier, and explain why the two are worth more as a pair than separately.
- Take a goal (“let’s reduce specific energy consumption”) and make it SMART. Which letter is easiest to slip on in practice, and why?
How does this show up in digital practice?
Section titled “How does this show up in digital practice?”The logic of the KPI does not stop at the paper board or the weekly spreadsheet: the same measure → dialogue → action loop is realized in software too, in any well-designed digital operating system. Instead of a hand-drawn board and scattered reports, here automatic data collection, mandatory fields and built-in action tracking ensure that the indicator lives in time, credibly and tied to action. The mechanism differs, the principle is the same.
| KPI principle | Digital implementation | What it adds |
|---|---|---|
| Few, focus KPIs | configurable board / dashboard per level | the vital few is visible, not everything measurable |
| Leading indicator | automatic, frequent (even hourly) data collection | the preventive signal arrives in time |
| SMART target | target value next to the indicator, automatic deviation flagging | the red/green status is visible immediately |
| Actionability | mandatory comment and action field tied to the deviation | the measurement turns into action, not a report |
| OGSM fit | linked KPI → PI → I hierarchy, aggregation | the levels do not drift apart |
| Auditability | timestamped, retrievable data trail | the decision and the deviation are documented |
Connection to OPEREX (shift log)
Section titled “Connection to OPEREX (shift log)”A KPI is worth only as much as the credibility and regularity with which it is measured. The daily measured values and deviations of the frontline-influenceable (often leading) indicators that underpin the focus KPIs — the daily parameters of a piece of equipment, unplanned losses, the status of preventive maintenance, for example — can be recorded in the OPEREX shift log in a structured way, with a timestamp and an auditable data trail. That way there is always source-faithful data behind the performance board and the review dialogue: the mandatory comment attached to a red deviation and the action decided on are documented, and the indicator can be aggregated into the higher-level management KPI. The ownership logic of “own your numbers” stays intact, but measurement and follow-up become a digitally closed loop.
Terminology (HU / EN / JP)
Section titled “Terminology (HU / EN / JP)”| Hungarian | English | 日本語 / note | |
|---|---|---|---|
| kulcs-teljesítménymutató | KPI — Key Performance Indicator | the highlighted key metric | |
| teljesítménymutató | PI — Performance Indicator | an intermediate indicator driving a KPI (see [[kpi-pi-i.en | KPI, PI, I]]) |
| indikátor | I — Indicator | a lower-level, influenceable measure | |
| előretekintő mutató | leading indicator | measures the cause, allows preventive intervention | |
| utólagos mutató | lagging indicator | measures the effect, cannot be corrected afterwards | |
| SMART cél | SMART target | Specific · Measurable · Attainable · Realistic · Time-bound | |
| kevés, lényeges mutató | the vital few | “track the vital few” | |
| hiúsági metrika | vanity metric | a pretty but non-actionable number | |
| stratégia-lebontás | OGSM / Hoshin | 方針 — the What/How, and thus the source of the KPI |
What is a KPI (key performance indicator)?
A KPI (Key Performance Indicator) is a simple and easily measurable key metric that is actionable (it can be influenced), has a significant effect on the organization’s performance, is typically non-financial in nature, and is often forward-looking (leading). It is part of a small, balanced set of indicators, and it is derived from the “What & How” work of strategy deployment.
What are the marks of a good KPI?
Five marks: simple and easily measurable; actionable; of significant organizational impact; typically non-financial; and often leading (forward-looking). And its target value is SMART: Specific, Measurable, Attainable/Achievable, Realistic/Results-oriented, Time-bound.
What does SMART mean for KPI targets?
Specific (the team can influence it), Measurable (it can be measured, and the measurement method is agreed), Attainable/Achievable (challenging yet reachable), Realistic/Results-oriented (with a realistic path, results-oriented) and Time-bound (tied to a deadline).
What is the difference between a leading and a lagging KPI?
A leading (forward-looking) indicator measures the cause that shapes the future result and allows a preventive intervention before the trouble arrives; a lagging (after-the-fact) indicator measures a result that has already happened and can no longer be corrected. A good program pairs the two, especially in process safety.
Why should a KPI rather be "non-financial" and "leading"?
Because a financial figure is a delayed, after-the-fact (lagging) result that the frontline can hardly influence in time. A non-financial, leading, causal indicator (availability, specific energy consumption or near misses, for example) can be influenced, and it allows intervention before the end result goes wrong.
What is NOT a good KPI?
One that the person looking at it cannot influence (not actionable), whose measurement is contested, or that is just a “pretty number” with no action behind it (a vanity metric). Such an indicator is information, not a KPI — and merely tracking a KPI without dialogue and action is not performance management.
Related concepts
Section titled “Related concepts”performance management · performance board · performance dialogue · KPI cascade · KPI, PI, I · leading and lagging indicators · ogsm · visual management · oee · pdca
Next step
Section titled “Next step”If you have understood this, from here it is worth going on — in this order:
- KPI cascade — how a focus KPI breaks down across the levels of the organization so that every level has an indicator it can influence itself.
- performance board — how a set of KPIs becomes a working, visual performance board in the shift.
- performance dialogue — how a measured deviation turns into dialogue and action, that is, how a KPI becomes genuine performance management.
References / further reading
Section titled “References / further reading”- OGP Report No. 456: Process Safety — Recommended Practice on Key Performance Indicators. International Association of Oil & Gas Producers (IOGP/OGP), 2011. The canonical, publicly available methodology for the leading/lagging KPI pair in process safety.
- SMART goal setting — G. T. Doran: There’s a S.M.A.R.T. way to write management’s goals and objectives. Management Review, 1981. The original, public source of the SMART acronym.