The change curve in the Lean transformation
≈ 21 min read · 4,121 words
You introduce a new system, say a digital shift diary or a 5S program, and the first reaction is not enthusiasm but a shrug: “We’ve always done it this way, why change?” A few weeks later the mood does not go up but down: grumbling, resistance, declining performance. Sound familiar? This is not the failure of the rollout, but the natural path of change. There is a well-describable curve that almost everyone goes through when they are jolted out of the familiar, and a leader who knows this curve does not panic at the low point, but knows where their people stand, and can guide them through it.
The change curve describes the emotional and energy stages a person or an organization passes through during a change. The typical path leads from shock and rejection, through the low point, to acceptance, experimentation and lasting success. The psychological basis of the model is Elisabeth Kübler-Ross’s theory of grief, which has also been applied to organizational change. The reaction is natural and predictable, so the leader’s task is not to eliminate it, but to guide the team through the low point with trust and quick, visible results.
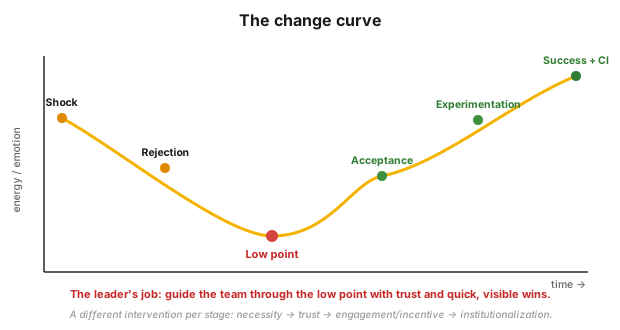 Figure 1 — the change curve: the energy level travels from shock and rejection, through the low point, to acceptance, experimentation and lasting success. The leader’s task is to guide the team through the low point.
Who is this for?
Section titled “Who is this for?”This article is for those who lead or live through change in practice: plant and shift supervisor · process engineer · project and change leader · Lean/CI navigator · HR and organizational development · HSE · team leader and opinion-leader operator.
Learning objectives
Section titled “Learning objectives”After reading this article you will be able to:
- recognize that a reaction to change is a natural and predictable process, not a personal weakness;
- identify which stage a person or team is in (comfort, resistance, experimentation, commitment);
- distinguish the curve of negatively and positively experienced change, and know the main risk of each;
- choose, stage by stage, the correct leadership intervention (necessity, trust, involvement, incentive);
- draw the line: when the change curve is not the right tool, and what to do instead.
The essence
Section titled “The essence”- Six energy stages: shock, rejection, low point, acceptance, experimentation, success and continuous improvement.
- The low point is the most critical: here the energy is lowest, and the risk of giving up is greatest.
- The reaction is predictable, not a fault. The leader’s job is not to bypass the emotions, but to lead through them.
- Acceptance calls for trust and a perceptible benefit, not more orders. The leader uses a different tool at each stage, and leads from the front as a role model.
- Two kinds of curve: negatively experienced change plunges into a deep depression valley (Kübler-Ross), positively experienced change dips only into a shallow “informed pessimism” valley.
- Lean is a marathon, not a sprint. At the low point perseverance is the key: you must keep going even when you “hit a wall.” The curve cannot be rushed, only supported — with communication, coaching and early quick wins.
- The “we’ve always done it this way” resistance is broken by a clear necessity and an attractive vision.
Why does it matter? (the stakes)
Section titled “Why does it matter? (the stakes)”Most Lean and digitalization initiatives fail not because the method is bad, but because leadership gives up at the low point. At the start of the curve everyone is enthusiastic, at the end everyone is satisfied, but between the two lies a valley where energy and performance temporarily fall below the starting level. Whoever does not expect this valley withdraws attention and resources exactly where they would be needed most, and the half-finished change slides back into the old rut.
The stake is therefore twofold. If you know the curve, then at the low point you provide presence, trust and quick wins, and the team gets across to the other side. If you do not know it, you experience the low point as a failure, you back off, and the invested energy is lost. The change curve is not a theoretical ornament but risk management: it shows where it will hurt, so you can time the support to land there.
Where does it come from? The five stages of grief
Section titled “Where does it come from? The five stages of grief”The psychological basis of the curve is the theory of Elisabeth Kübler-Ross, the Swiss-American psychiatrist, which she set out in her book On Death and Dying (1969). Originally it described the psychology of dying, but the model soon gained wider validity: it fits the processing of any loss or major change. Organizational development borrowed the idea of the “change curve” from here, because workplace change too involves a loss: the loss of the familiar, predictable situation.
The five stages of Kübler-Ross are as follows:
| Stage | What it means |
|---|---|
| 1. Denial | The conscious or unconscious rejection of the facts, the information, reality. A defense mechanism, entirely natural. Some get stuck here for a long time, when the inevitability of the change is hard to accept. |
| 2. Anger | It can appear in many ways: a person may be angry at themselves and/or at others, especially those close to them. Knowing this helps to stay calm and non-judgmental when meeting someone’s upset anger. |
| 3. Bargaining | Traditionally a bargain with one’s own god; in a less serious situation, a search for compromise (for example “Can we at least stay friends?” at a breakup). It rarely yields a sustainable solution. |
| 4. Depression | “Preparatory grieving,” the dress rehearsal of the consequences. Acceptance filled with emotional attachment: the sadness, the regret, the fear are natural. It signals that the person has at least begun to accept reality. |
| 5. Acceptance | A sign of a certain emotional detachment and objectivity. It is situation-dependent: the dying, for example, may reach it far sooner than those left behind, who have to work through their own grief. |
The point is not to memorize the stages, but the realization: the difficult reaction (the denial, the anger) is not ill will, but a station of a process. This viewpoint is what makes the leader calm and patient.
What emotional stages does an organization go through during a change?
Section titled “What emotional stages does an organization go through during a change?”An organization goes through the same curve as the individual, only multiplied: every person moves at their own pace, and the leader has to handle several stages at once. The reaction follows a natural and predictable pattern, whether the change is experienced as positive or negative. The three views below show the same phenomenon from three angles: the four-zone map draws the behavior, while the negative and positive curves draw the emotional path.
The four zones of change (behavior map)
Section titled “The four zones of change (behavior map)”When someone encounters change, their reaction can be placed on a four-zone map along two axes: whether they tie their attention to the past or the future (looking back ↔ looking ahead), and whether they experience the situation as stable or chaotic (stability ↔ chaos). A person moves through the four zones in a circle: from the familiar stability they plunge into chaos, then, through experimentation, reach a new stability.
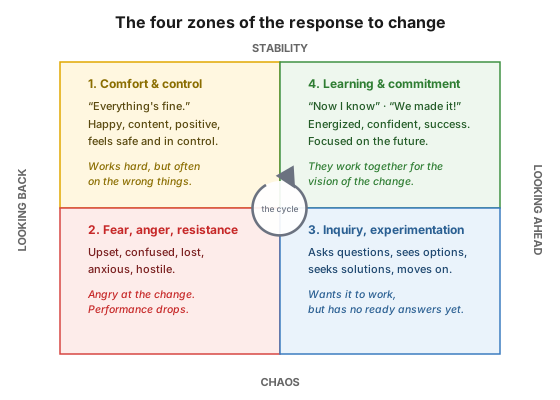 Figure 2 — the four zones of the response to change. The path leads from zone 1 (comfort) through zone 2 (resistance), then zone 3 (experimentation), to zone 4 (commitment), in a circle.
| Zone | What they feel and do | What happens |
|---|---|---|
| 1. Comfort and control | “Everything’s fine,” no problem, happy, content, positive: “I’m okay!” | People feel safe and in control. They work hard, but too often on the wrong things. |
| 2. Fear, anger and resistance | upset, confused, lost, anxious, hostile, lacking confidence | Frustrated, angry at the change. Performance deteriorates. |
| 3. Inquiry, experimentation and discovery | confused, but questioning, sees an opportunity, seeks a solution, gropes in every direction | Wants the change to work, but has no ready answers yet. |
| 4. Learning, acceptance and commitment | “Now I know,” energized, confident, success: “We made it!” | They focus on the future and are excited about it. They start working together for the vision of the change. |
Negatively experienced change: seven stages
Section titled “Negatively experienced change: seven stages”If someone experiences the change as a loss, the Kübler-Ross logic can be broken into seven stations along the axis of morale, energy and performance, as a function of time. The first four stations are the phase of looking back, the last two of looking ahead, and between them lies the transition, the point where a person stops defending the past and begins to seek the future.
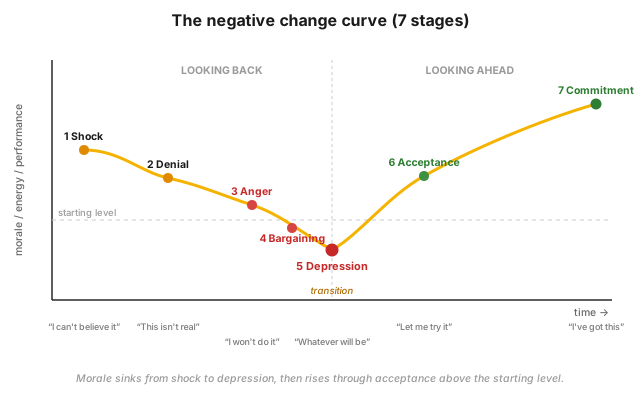 Figure 3 — the seven stages of negative change. Morale sinks from shock to the depression low point, then rises above the starting level through acceptance and commitment.
| # | Stage | Typical inner voice | Characteristic |
|---|---|---|---|
| 1 | Shock | “I can’t believe it,” “I don’t know what to do” | the news hits home, paralysis |
| 2 | Denial | “This isn’t really happening” | fending off reality |
| 3 | Anger and blame | “I won’t do it” | passive or active resistance |
| 4 | Bargaining and self-blame | “I should have done it differently,” “Couldn’t we instead do…” | attaching conditions, guilt |
| — | Transition | — | the turn from looking back to looking ahead |
| 5 | Depression | “Whatever will be, will be” | the low point of the curve, the lowest energy |
| 6 | Acceptance and discovering something new | “Let me try it” | here the discovery and the learning begin |
| 7 | Commitment and contribution | “I’ve got this,” “I can do this better” | new energy, taking possession of the new state |
The morale curve sinks from shock to depression, then rises above the starting level through acceptance and commitment. The good news is that at the end of the curve a person is usually at a higher energy level than they were before the change.
Positively experienced change: the risk of disillusionment
Section titled “Positively experienced change: the risk of disillusionment”Not every change is experienced as a loss. Positively experienced change has a different curve: here the risk is not the low point but the disillusionment. The enthusiasm overruns reality, then turns into disappointment, and finally settles back on a realistic footing.
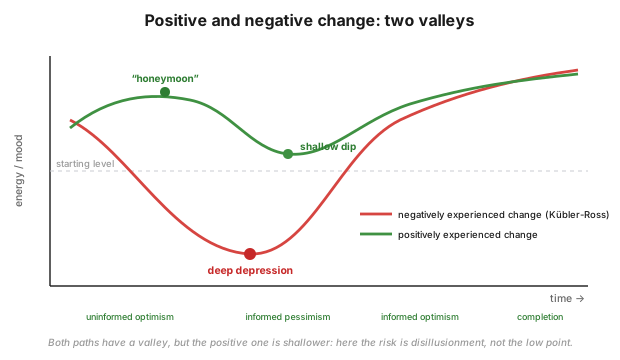 Figure 4 — the comparison of the positive and negative curves. Both paths have a valley, but on the positive path it is shallower: here the risk is disillusionment, not the low point.
| Stage | What happens |
|---|---|
| 1. Uninformed optimism | The person is excited, awaits the change, builds an overly optimistic picture (everything will be easier, all their troubles will be solved). After the change comes the honeymoon period, when they are genuinely happy. |
| 2. Informed pessimism | The honeymoon does not last forever: the rose-tinted glasses fade as the messiness of reality sets in. It turns out not everything fell into place, and it is not so easy after all. Gloom and grumbling arrive, but this is shallower than the depression of the negative curve (unless the person tips over into a delayed negative cycle). |
| 3. Informed optimism | The original optimism returns, now aligned with reality. “It’s not so bad after all.” Looking around and talking with others, they make realistic plans and move forward with informed optimism. |
| 4. Completion | Things settle onto a stable, realistically working platform. The person is probably happier than before the change, and with their realistic vision may even reach higher. |
The shared lesson of the two curves: the valley appears on both paths. The question is its depth, and whether the person is guided through it. This is another reason the realization matters: a positive start is no guarantee; after the honeymoon comes the harder part.
The stages and the correct leadership intervention
Section titled “The stages and the correct leadership intervention”The curve is a practical tool precisely because it calls for a different intervention at each stage. The same encouragement that helps at the shock is already a shackle at the experimentation stage, and vice versa. The leadership “timetable” is as follows:
| Stage | Characteristic | Correct leadership intervention |
|---|---|---|
| Shock / Rejection | “We’ve always done it this way!” | building necessity and desire: a clear reason for the change, plus an attractive vision |
| Low point (depression) | lowest energy, attrition | building trust and showing a quick, tangible benefit |
| Acceptance | trust, perceptible benefit | engagement and incentives |
| Experimentation | trying, learning | space and support for the experiments, permission to make mistakes |
| Success + continuous improvement | sustained high energy | reinforcement, institutionalizing the good practice (CI) |
The low point is unavoidable: the question is not whether it will come, but whether the leader guides the team through it. The most important thing for this is leadership presence and the role-model role: to be there, to encourage and to drive for results, as Lean leadership also teaches (see Lean leadership, Lean behavioral change). Practical experience shows that at the low point what counts most is the presence of the navigator (the internal coach accompanying the change) and a few early successes seen by everyone.
Process-industry context and safety
Section titled “Process-industry context and safety”The change curve is not valid only for office reorganizations. In a safety culture change at a Seveso plant the same curve operates. When a plant introduces a new permit-to-work (PTW) system or a near-miss reporting practice, the first reaction is usually resistance: “it has been safe so far, why the extra administration?” This is the rejection stage of the curve, with textbook precision.
- At the low point here too, trust and a quick, visible result are needed. If within a few weeks the operators see that the new near-miss system really has prevented an accident, or that structured permitting is faster, not slower, trust builds, and the curve begins to turn upward.
- Opinion-leader operators are key players. In a plant the informal leaders of a shift carry the others through the low point faster than any presentation. It is worth involving them first and holding them up as role models.
- Safety boundary. The change curve handles the human side of change, not the technical risk. A safety-critical change (a technology modification, a new material, a tie-in) never rests on the emotional curve, but on the formal change management (MOC) and the risk analysis (HAZOP, LOPA/SIL). The curve helps you take the people through the change, but it does not replace the technical approval.
Introduction in practice (roadmap)
Section titled “Introduction in practice (roadmap)”The change curve becomes a tool when you take the team through it in a concrete change. A shift supervisor can start like this tomorrow:
- Name the necessity. Say clearly and honestly why the change is needed, and what will get better from it. Do not sugarcoat: “we’ve always done it this way” is only broken by a convincing reason and an attractive vision.
- Recognize where each person stands. Using the curve, look at who is still in denial, who is angry, who is already experimenting. Do not treat them the same: one needs encouragement, another needs space.
- Be present at the low point. When the mood is at its worst, do not disappear into your office. Walk the gemba, listen, build trust, and find a quick, visible success (quick win) that everyone can see.
- Give space to experimentation. In zone 3, let them try, and accept that not everything will be right the first time. Forbidding mistakes pushes people back into zone 2.
- Institutionalize the success. When the team has crossed to the other side, lock in the proven practice (standard work), celebrate the success, and tie it to the next improvement: this is how the change curve becomes continuous improvement.
Common mistakes
Section titled “Common mistakes”- We experience the low point as a failure. When mood and performance fall, leadership panics and backs off. Instead: expect the valley; the low point is part of the process, not proof that the decision was wrong.
- We try to push it through with more orders. In the depression stage, increasing the pressure only deepens the resistance. Instead: give trust and a quick, visible benefit, not commands.
- We rush people straight into acceptance. “Stop nitpicking, just accept it already.” The stages cannot be skipped. Instead: accompany them through, with communication and coaching; every step has its significance.
- We treat everyone the same. Someone still in denial needs something different from someone already experimenting. Instead: diagnose from the curve where each person stands, and tailor the intervention.
- The leader disappears at the low point. Just when presence would be needed most, leadership “leaves it to sort itself out.” Instead: at the low point, visibility, presence and the role-model role are the most important.
- We take the positive start as a guarantee. We feel the disillusionment after the honeymoon as a betrayal. Instead: the valley of informed pessimism is natural on the positive path too; be prepared for it.
When NOT to use it? (limits of the method)
Section titled “When NOT to use it? (limits of the method)”The change curve is for understanding and leading the human, emotional side of change. There are times when another tool is the right answer:
| Situation | Why (primarily) not the change curve | The right answer |
|---|---|---|
| A technical-safety change needs approval | the curve handles the emotion, not the technical risk | formal change management (MOC) + HAZOP / LOPA/SIL |
| The problem is really a bad plan or missing resource | it is not the people’s emotions that are the trouble, but the change itself is bad | fixing the plan, providing resources, not “emotional management” |
| There is no real reason for the change | the curve does not legitimize an unjustified change | first clarify the necessity (change formula) |
| Individual, clinical-level distress | the model is an organizational tool, not therapy | professional support, HR, occupational health |
Rule of thumb: the change curve is good for understanding and leading people’s reaction to a legitimate change. It is not a tool for “pushing” a bad decision or an incomplete plan through the organization, and it does not substitute for the technical-safety approval.
Take it home (keys)
Section titled “Take it home (keys)”- The valley is unavoidable, but temporary. Expect the low point, and do not experience it as a failure; after it comes the upward arc.
- Diagnose, then intervene. Look at which zone each person is in, and give something different at each stage: necessity, trust, involvement, space.
- At the low point, presence and quick success are needed, not more orders. Build trust and show an early, visible result.
- Lead as a role model. The team watches how you behave in the difficult stage; your perseverance gives them theirs.
- The change curve takes the people across, not the technical risk. In a safety-critical change, MOC and risk analysis are in charge.
- A marathon, not a sprint. Perseverance at the low point matters more than enthusiasm at the start.
Self-test
Section titled “Self-test”- A team member says: “This whole thing is unnecessary, it worked fine before.” Which stage are they in, and what leadership intervention is right at this point?
- What is the main difference between the curve of negatively and positively experienced change, and what is the characteristic risk of each?
- Why is it a mistake to respond at the low point with more pressure and more orders, and what should be done instead?
How does it appear in digital practice?
Section titled “How does it appear in digital practice?”Handling the change curve looks at first glance like a purely human task, but the most important leadership tool at the low point, trust + a quick, visible success, depends largely on whether the organization sees its own results. This is where digital operation comes in: a good system does not automate the emotion, but makes the progress and the early successes visible, exactly at the point where the team needs it most.
| Element of the change curve | Digital implementation | What it gives to change leadership |
|---|---|---|
| Quick, visible success (at the low point) | a real-time results dashboard, before-and-after metrics | the team sees with its own eyes that the change works |
| “Where each person stands” diagnosis | regular, structured feedback and mood surveys, logged | the leader sees from data where the organization stands on the curve |
| Building trust | transparent action and result tracking accessible to all | “what we promised, we delivered”: the trail of trust is documented |
| Preserving early successes | the proven practice recorded as a digital standard | the quick win is not lost but institutionalized |
| Institutionalization (CI) | the corrective actions and lessons as tracked, closable items | the success becomes continuous improvement, not a one-off flare-up |
Connection to OPEREX (shift diary)
Section titled “Connection to OPEREX (shift diary)”A digital shift diary, such as OPEREX, provides tangible evidence at the low point. When a plant introduces a new practice (a structured shift handover, near-miss reporting, a standard operator round), the diary automatically records the impact: fewer missed handovers, faster permitting, more near-misses caught. These visible early successes extracted from the diary provide exactly the evidence with which the leader builds trust at the low point: not promising, but showing, that the change works. The diary is thus at once the measuring instrument of the rollout’s result and the tool of trust-building.
Terminology (HU / EN / JP)
Section titled “Terminology (HU / EN / JP)”| Hungarian | English | Japanese / note |
|---|---|---|
| Változási görbe | change curve | the organizational adaptation of the Kübler-Ross model |
| Gyász öt szakasza | five stages of grief | Kübler-Ross, 1969 |
| Sokk / elutasítás | shock / rejection | the start of the curve |
| Mélypont / depresszió | depression / trough | the point of lowest energy |
| Elfogadás | acceptance | the turning point upward |
| Elköteleződés | commitment | taking possession of the new state |
| Kitartás | perseverance | to keep going even when “hitting a wall” |
| Tájékozatlan / tájékozott optimizmus | uninformed / informed optimism | the stages of the positive curve |
| Mézeshetek | honeymoon period | the early peak of the positive curve |
| Szükségszerűség | necessity | the clear reason for the change |
What is the most critical point of the change curve?
The low point (depression), where the energy level is lowest and the risk of giving up is greatest. Here the leader must build trust and show quick, tangible results, rather than increasing the pressure.
How can the "we've always done it this way" resistance be overcome?
By building necessity and desire: a clear, honest reason for the change, plus an attractive vision. The leader leads from the front as a role model, and builds trust with a perceptible benefit, not with orders.
What is the difference between the positive and the negative change curve?
Both contain a valley, but of differing depth. Negative change (Kübler-Ross) passes through shock, denial, anger and bargaining to the depression low point, then into acceptance. Positive change starts with the honeymoon of uninformed optimism, then passes through the gloom of informed pessimism into informed optimism and completion. This gloom is shallower than the negative depression, unless the person tips over into a delayed negative cycle.
Who developed the psychological basis of the change curve?
Elisabeth Kübler-Ross, the Swiss-American psychiatrist, in her book On Death and Dying (1969), where she first described the five stages of grief (denial, anger, bargaining, depression, acceptance). The model was later applied to organizational change as well.
Does the change curve replace formal change management (MOC)?
No. The change curve handles the human, emotional side of change. A technical or safety-critical change must always be approved through the formal MOC process and the risk analysis (HAZOP, LOPA/SIL); the curve helps you take the people through the change.
Related concepts
Section titled “Related concepts”the change formula · resistance to change · behaviour change · Lean leadership · the iceberg model · the transformation journey · lean-navigator
Next step
Section titled “Next step”If you have understood this, from here it is worth going on, in this order:
- the change formula — the “formula” of change (dissatisfaction × vision × first step > resistance): this tells you how to build a reason strong enough for the team to set off on the curve at all.
- resistance to change — a deeper understanding of resistance: what lies behind “we’ve always done it this way,” and how it can be broken down.
- Lean leadership — the leadership behavior with which you guide the team through the low point: presence, coaching, the role-model role.
References / Further reading
Section titled “References / Further reading”- Elisabeth Kübler-Ross: On Death and Dying. Macmillan, 1969. — the foundational work on the five stages of grief, the psychological root of the change curve.
- Kübler-Ross change curve (organizational adaptation) — the widely used form of the model applied to change management; overview: changingminds.org, “Kubler-Ross grief cycle”.