Policy Deployment (Hoshin Kanri) and catchball — strategy breakdown by consensus
≈ 23 min read · 4,560 words
Four people pull a heavy weight on ropes — except one of them pulls the opposite way. Three forward, one back: the pulling force is 1+1+1−1, so out of four people only two are actually put to use. It would be enough for all four to pull in the same direction, and the same team would move with its full force. This is exactly what happens in most organizations: everyone is working, there are plenty of good initiatives, yet the strategy does not move. Policy deployment, in Japanese Hoshin Kanri, answers this: it marks out the few truly important directions, and makes sure they land the same way on everyone’s rope. The key is a strangely named move, the catchball. Let’s look at what it is, how it works, and when to do it with which tool.
Policy deployment (in Japanese Hoshin Kanri) is a strategic framework that focuses resources on the company’s few critical success factors. It breaks the strategy down along the key processes, and measures and feeds back the results. In Lean it gives the direction, the planning and the project sequence — the lack of these is one of the main pitfalls of Lean initiatives. The breakdown is not a one-way “drop” but catchball: the goals and metrics cascade back and forth, by consensus, between the levels — because, as the tug-of-war analogy shows, full force lines up behind the consensual goals and roughly half behind the forced ones.
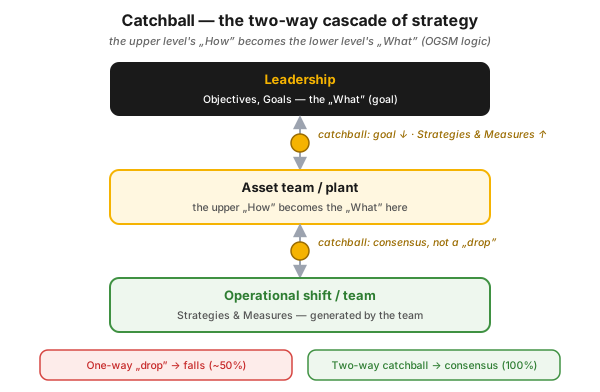
Figure 1 — the catchball strategy cascade. The goal is not “dropped” but thrown back and forth: the upper level’s “How” becomes the lower level’s “What” (OGSM logic), and the lower level itself generates its own Strategies & Measures row. As the tug-of-war analogy shows, roughly half the force lines up behind the one-way drop, full force behind the two-way catchball.
Who is this for?
Section titled “Who is this for?”This article is for those who run into the gap between strategy and daily operation: plant manager · shift supervisor · asset team lead · technologist · process engineer · Lean/CI specialist · performance-management lead · HSE · senior executive.
Learning objectives
Section titled “Learning objectives”After reading this article you will be able to:
- explain what policy deployment is and why it is the often-missing element of Lean rollouts;
- walk through the six steps from the critical success factors to the detailed process mapping;
- distinguish the framework (Hoshin) from the tool (OGSM), and say when you need which;
- run a catchball round at your own level, and recognize when the “ball has dropped”;
- recognize the situations where policy deployment is the wrong tool.
In brief
Section titled “In brief”- One of the main pitfalls of Lean rollouts is not a lack of tool knowledge, but a lack of direction, planning and project sequence. Many initiatives fizzle out because of a lack of senior-leadership foresight.
- Hoshin Kanri = policy deployment. The same strategy-breakdown and feedback process; Hoshin is the Japanese name.
- The focus is on the critical success factors (CSF): a limited number of key areas where “everything must go well” for success (for example market growth, employee engagement).
- Six steps: CSFs → business metrics → stepped objectives → key processes → matching process to target area → detailed mapping.
- Realistic time horizon: a 3–5 year conversion program, with a long-term vision and stepped objectives every 6 or 12 months, not a single 6-month goal.
- 4–10 key processes (not the BPR-style 100+ processes); it is often worth starting with order fulfilment.
- Catchball: the cascade is a two-way dialogue. If the leader “throws” the strategy without warning, the ball drops; the deliberate throwing back and forth creates understanding and commitment.
- Hoshin is the framework, OGSM is the tool; the rhythm of daily execution is given by MOS.
Why does it matter? (the stakes)
Section titled “Why does it matter? (the stakes)”The stake is not that “we won’t have a strategy document.” We will. The stake is that the organization’s energy scatters, and this turns into cost step by step:
- No few important directions are marked out → every department follows its own priority.
- The sequence of improvement projects is haphazard → interdependent steps start in the wrong order, and the result of the earlier ones is lost.
- The metrics are not tied to a success factor → the reports grow, the direction does not clear up.
- The front line does not understand why they are doing it → the goal is formally met, but not in substance.
- The initiative fizzles out → in the next round the organization is already cynical, and the next program is harder to launch too.
The last point is the most expensive: a dead Lean program takes away not only the missed result but also the credibility of the next attempt.
What is policy deployment (Hoshin Kanri), and why is it Lean’s missing link?
Section titled “What is policy deployment (Hoshin Kanri), and why is it Lean’s missing link?”Policy deployment is the leadership process that translates strategic intent into concrete, measurable, owner-assigned initiatives, then measures and feeds back the result. For one of the main obstacles to a successful Lean rollout is not knowing the tools, but the lack of direction, planning and the right project sequence.
Many organizations know 5S, VSM and kaizen, yet still get stuck, because there is nothing to rank and align the initiatives with the strategy. Policy deployment fills this gap.
Hoshin focuses on the critical success factors (CSF) — the few key areas where you have to perform well. It classifies the processes according to how they affect the goals:
| Process type | What it means | The leadership task |
|---|---|---|
| Strategic | marks out the general direction, but does not directly affect the target numbers | this is where direction and priority are decided (policy deployment itself belongs here) |
| Core | directly affects the target numbers, this delivers the targeted result | this is where the focus of improvement capacity sits: the targeted improvement typically comes from the core processes |
| Support | indirectly affects the goals, serves the other two | must be run efficiently and cheaply |
Which are the six steps?
Section titled “Which are the six steps?”The senior-leadership process of policy deployment consists of six steps, from working out the critical success factors to selecting the processes to be mapped in detail. The order cannot be swapped: each step works from the output of the previous one.
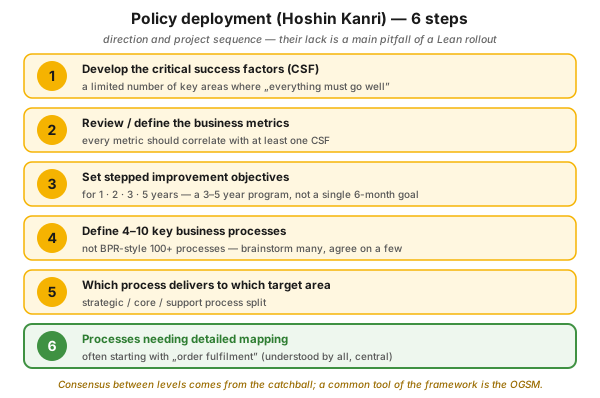
Figure 2 — the six steps of policy deployment. It starts from the top (critical success factors) and leads to the detailed process mapping, often starting with the order fulfilment process, because it is understandable to everyone and central.
- Work out the critical success factors (CSF). Through brainstorming, identify the key forces (the general business environment, industry-, customer- and company-specific factors), and develop CSFs for these.
- Review and define the business metrics. Check whether the existing (often financial) metrics fit the CSFs: every metric should correlate with at least one CSF. This ties the KPIs to the strategy.
- Set stepped improvement objectives for 1, 2, 3 and 5 years. The 3–5 year program advances with stepped objectives, typically reviewed every 6 or 12 months, not with a single short goal.
- Define 4–10 key business processes. Do not fall into the BPR trap (defining 100+ processes): brainstorm many, but agree on a few.
- Match the processes to the target areas. Decide which process delivers benefit on which target area (strategic / core / support split).
- Select the processes that need detailed mapping. Often order fulfilment is the good starting point, because it is understandable to everyone and central.
What does catchball mean?
Section titled “What does catchball mean?”Catchball is the two-way dialogue of the strategy breakdown: the upper level makes a proposal, the lower level asks back and adds its own way of implementing it, until consensus is reached. The breakdown fails when it is one-way.
The metaphor is tangible: the leader “throws the ball” (the strategy), and if they do it without warning, the team drops it. Leaders often think they have cascaded the vision, when they have merely thrown it. The solution is for the two sides to deliberately throw the ball to each other, because this is how consensus and understanding are built at every level of the cascade.
Catchball fits organically with OGSM: the Strategies and Measures column of the lower levels is generated by that team itself, not received from above (the upper level’s How becomes the lower level’s What). The tug-of-war exercise illustrates this: full force lines up behind aligned, consensual goals, and roughly half behind forced, inconsistent ones. The lesson is sharp: polishing the “throw” of the strategy is not enough on its own, because communication is the bottleneck.
Policy deployment or OGSM — what is the difference, and when which one?
Section titled “Policy deployment or OGSM — what is the difference, and when which one?”Policy deployment (Hoshin Kanri) is the framework, OGSM is the tool: Hoshin tells you what we break down and onto what, OGSM gives in what form we hand it over from level to level. The two do not compete with each other; rather, without each other neither works well.
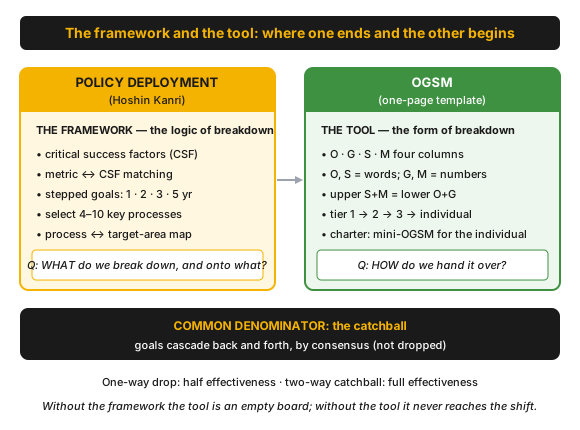
Figure 3 — delimiting the framework and the tool. Hoshin asks about the critical success factors and the key processes, OGSM gives the form of the one-page, tier-by-tier handover; the common denominator is the catchball.
| Aspect | Policy deployment (Hoshin Kanri) | OGSM |
|---|---|---|
| What is it? | a leadership framework, the logic of the breakdown | a one-page template, the form of the breakdown |
| Its main question | what do we break down, and onto what? | how do we hand it over from level to level? |
| Its output | critical success factors, key processes, stepped goals | O · G · S · M rows per tier |
| Its basic unit | the process (4–10 key processes) | the level (tier 1 → 2 → 3 → individual) |
| Its cascade mechanism | the target-area–process matching | copying the upper S + M into lower O + G |
| Its time horizon | a 3–5 year program, with 1·2·3·5 year steps | tier-by-tier, annual and sub-annual cycles |
| Its classic visual tool | X-matrix (from the Hoshin literature) | the OGSM board itself |
| What it reaches for first | the process map and the metric set | the division into organizational levels |
When should you reach for which?
- Start with Hoshin if it is not yet decided what you want to improve: there are no critical success factors, the metrics are not tied to strategy, or twenty initiatives are running at once. In that case an OGSM board just puts the chaos into a nice form.
- Start with OGSM if the direction is already clear but does not get down: the upper level knows what it wants, yet the shift still cannot say which corporate goal its weekly indicator belongs to. Here the gap is the form and the level-by-level handover.
- Hoshin and OGSM together are normal operation: the framework gives the content (what, onto what, on which process), the tool gives the form of the breakdown (to whom, in what order, with what metric).
And the X-matrix? In the Hoshin Kanri literature (Akao, Dennis; see the References), the classic visual tool is the X-matrix: on a single sheet, in an X shape, it links the long-term goals, the annual goals, the key initiatives, the metrics and the owners, so that a single diagram shows what relates to what. OGSM is its simplified, columnar counterpart; the essence in both is the same, making the focus and the relationships visible.
Where is MOS in the picture? The daily and weekly execution rhythm of the broken-down goals is given by the review cascade of MOS (Management Operating System) and the performance board, while the KPI cascade carries the indicators further through the organization. In short: Hoshin = what and onto what · OGSM = in what form · MOS = in what rhythm.
Process-industry context and safety
Section titled “Process-industry context and safety”In a process-industry environment, policy deployment leads the strategic goal (energy efficiency, reliability, safety performance) down to block-, plant- and shift-level metrics, linking it to the KPI/PI/I hierarchy.
Safety here is not “one of the goals.” Among the critical success factors, process safety and personal safety consistently override the purely production goals. The safety benefit of catchball is that the front line, which has itself shaped the goals, is far more committed to safe execution than in the case of a goal dropped from above. For a forced goal leads to workarounds and hidden risk.
Introduction in practice (roadmap)
Section titled “Introduction in practice (roadmap)”Policy deployment starts from the top, but is not produced from the top. Suggested order:
0. Precondition. There should be a long-term vision (a durable direction, without target numbers) and a working performance forum (performance board, MOS). Without these, the breakdown has nowhere to land.
- Create the critical success factors in a senior-leadership workshop. Limit their number: if everything is critical, nothing is.
- Audit the existing metric set against the CSFs. Any indicator that correlates with not a single CSF is a candidate for removal.
- Draw up the stepped goals for 1, 2, 3 and 5 years. The intermediate steps provide the feedback; a single five-year number does not steer.
- Mark out the 4–10 key processes, and match them to the target areas (strategic / core / support).
- Choose one process for detailed mapping, typically order fulfilment, and produce the VSM for it.
- Cast it into OGSM form, and cascade with catchball from tier to tier: the O and G are given from above, the S and M are the given level’s own work.
- Set the review rhythm (MOS) and the system owner who facilitates the cycle.
Who does what: senior management provides the vision, the CSFs and the top-level goals; the area and plant managers generate their own strategies and metrics in the catchball round; the shift supervisors take it down to the daily indicators; the system owner keeps the cycle alive.
Practical exercise. Choose one current target number of your own area. Write in one line: which critical success factor it relates to, which process moves it, and who formulated the “how” that goes with it. If you cannot fill in any of the three fields, you have found the break in the breakdown.
Measurement and audit
Section titled “Measurement and audit”The quality of policy deployment itself is not shown by how many nice slides were made, but by whether the chain is closed. Auditable signs:
| What you look at | Healthy sign | Warning sign |
|---|---|---|
| Metric ↔ CSF | every indicator can be tied to at least one CSF | “inherited” reports with ownerless indicators |
| Number of key processes | 4–10, with a name and an owner | BPR-style 100+ or none at all |
| Stepped goals | 1·2·3·5 year steps, reviewed every 6 or 12 months | a single year-end number |
| Trace of catchball | the lower level’s own-worded S/M | the upper level’s text verbatim on the lower level’s board |
| Review rhythm | scheduled, data-driven, gap-focused | ad-hoc, excuse-making |
| Traceability | from a shift-level indicator you can climb up to the corporate goal | the chain breaks somewhere |
The strongest single-question audit: ask an operator or shift supervisor which corporate goal their weekly indicator serves. If they don’t know, the cascade exists on paper but not in reality.
Common mistakes
Section titled “Common mistakes”- Starting with tools, without direction. 5S, VSM and kaizen without policy deployment are an unaligned, fizzling-out initiative. Instead: first the CSFs and the key processes, then the tool choice.
- A one-way “drop.” In a cascade without warning and dialogue the ball drops, and there is no commitment. Instead: a deliberate catchball round at every level, where the lower level itself formulates the “how.”
- Too many key processes (the BPR trap). With 100+ processes defined BPR-style, the focus is lost. Instead: 4–10 processes, with a name and an owner.
- A single short goal. A 3–5 year vision without stepped goals is either unrealistic or short-sighted. Instead: 1·2·3·5 year steps, measured back every 6 or 12 months.
- A metric without a CSF. If a KPI does not correlate with a single critical success factor, then it measures noise, not strategy. Instead: a metric audit against the CSF list, and removing the ownerless indicators.
- “Polishing” the strategy instead of the communication. The bottleneck is the dialogue of the breakdown, not the text of the strategy. Instead: in the next round, don’t fix the text but the way of aligning.
- Filling in the OGSM board without a framework. The template by itself ranks nothing; it merely casts the existing priorities into form. Instead: first the Hoshin questions (what, onto what, on which process), then the board.
When NOT to use it? (limits of the method)
Section titled “When NOT to use it? (limits of the method)”Policy deployment is a slow, consensus-hungry system that thinks in yearly orders of magnitude. There are places where this is exactly wrong:
| Situation | Why (primarily) not policy deployment | The right answer | ||
|---|---|---|---|---|
| Acute plant upset, safety event | the catchball round measures in days-to-weeks, here there are minutes | emergency procedure, [[moc.en | MOC]], subsequent [[a3-riport.en | root-cause analysis]] |
| A single, well-bounded technical problem | it does not need a strategic framework | targeted problem solving ([[pdca.en | PDCA]], [[5-miert.en | 5-Why]]) |
| A very unstable base process | the broken-down goal cannot be held without a stable process | first stabilization ([[standard-munka.en | standard work]], [[5s.en | 5S]]), then breakdown |
| No senior-leadership commitment | the framework starts from the top, it cannot be supplied from below | do not launch a full cascade, start with an area pilot | ||
| A fast-changing, unpredictable environment | the 1·2·3·5 year steps assume the stability of the direction | shorter cycles, more frequent review with the steps redefined |
Rule of thumb: policy deployment is strongest for a multi-year change of direction that spans several organizational levels. For a single problem, an acute situation and an unstable base process, this is not the tool.
Take it home (keys)
Section titled “Take it home (keys)”- Lean programs are typically killed by a lack of direction, not a lack of tool knowledge. If an initiative fizzles out, look at the breakdown first, not the training.
- A few critical success factors, 4–10 key processes. If everything is important, nothing is.
- Catchball is not a style but an effectiveness. As the tug-of-war analogy shows, full force lines up behind a consensual goal, roughly half behind a forced one.
- Hoshin = what and onto what · OGSM = in what form · MOS = in what rhythm. If something does not work, first identify which of the three is missing.
- Every metric should have a success factor. An ownerless indicator measures noise.
- The safety limit is not negotiable in the catchball round. If a goal can only be met by consuming the margin, the goal is the faulty one.
Self-test
Section titled “Self-test”- A plant manager receives next year’s target numbers by email, then forwards them to the shift supervisors. What is missing from the process, and what will be its consequence?
- What is the difference between policy deployment and OGSM, and which would you start with in an organization where twenty parallel improvement projects are running without a clear priority?
- A KPI report contains fourteen indicators. With what single question do you filter them by the Hoshin logic, and what happens to those that fail it?
Answer key
- Catchball is missing: this is a one-way “drop,” not a two-way dialogue. The lower level did not formulate its own Strategies and Measures row, meaning it did not come up with the “how” itself. Consequence: the goal is formally met, but not in substance, without commitment. As the tug-of-war analogy shows, roughly half the force lines up behind a forced goal, versus the full force behind a consensual one. Auditable trace: the upper level’s text appears verbatim on the lower level’s board.
- Policy deployment (Hoshin) is the framework, OGSM is the tool: the framework tells you what we break down and onto what (critical success factors, key processes, stepped goals), the tool tells you in what form we hand it over from level to level. With twenty parallel projects you have to start with Hoshin, because here it is not the form that is missing but the ranking: an OGSM board would only cast the chaos into form.
- The question: “which critical success factor does this indicator correlate with?” The rule is that every metric should correlate with at least one CSF (but not necessarily with all). Any indicator that cannot be tied to a single CSF is ownerless: it measures noise, not strategy, and is therefore a candidate for removal, not for further reporting.
How does it appear in digital practice?
Section titled “How does it appear in digital practice?”The principle of strategy breakdown does not stop at the workshop flipchart: the same logic is realized in software too. Instead of the paper-based OGSM board and the X-matrix pinned to the wall, here a linked goal hierarchy, versioned agreement trail and automatic gap reporting carry the same work — the mechanism differs, the principle is the same.
| Policy deployment element | Digital implementation | What it delivers |
|---|---|---|
| Goal cascade (upper S+M → lower O+G) | a linked goal hierarchy where every goal points to a parent | the chain can be traced by machine from the shift to the corporate goal |
| Catchball agreement | versioned goal text, comment thread, approval step | it is visible who formulated the “how,” and when the consensus was reached |
| Metric ↔ success-factor link | a mandatory field: which CSF the indicator belongs to | the ownerless indicators automatically stand out |
| Stepped goals | time-series target values with milestones | the gap (the difference between plan and actual) is continuously visible, not only at year-end |
| Review rhythm | scheduled forums, an automatic agenda from the biggest gaps | the review becomes data-driven, not excuse-making |
| Action tracking | owner, deadline, status for every gap | the output of the review is not lost until the next cycle |
Connection to OPEREX (shift log)
Section titled “Connection to OPEREX (shift log)”The weakest point of policy deployment is the gap between the breakdown and the daily reality: the nicely formulated goals and the actual activity of the shift drift apart. The OPEREX shift log bridges this: the stepped objectives, their project owners, deadlines and KPIs, and the catchball agreements between the levels can be recorded with timestamps, auditably. This way the progress of the goals and the reviews are retrievable, and the strategy breakdown meets the daily and weekly review rhythm of MOS and the actual data of the performance board. Hoshin does not remain a presentation but a living direction, followed in the shift too.
Terminology (HU / EN / JP)
Section titled “Terminology (HU / EN / JP)”| Hungarian | English | Japanese / Note |
|---|---|---|
| stratégia-lebontás | policy deployment | Hoshin Kanri (方針管理) |
| kritikus sikertényező | critical success factor (CSF) | the few focus areas where you have to perform well |
| catchball (labdadobás) | catchball | a two-way, consensual cascade between the levels |
| lépcsőzetes cél | stepped / breakthrough objective | in 1·2·3·5 year steps |
| kulcsfolyamat | key business process | 4–10 of them, with a name and an owner |
| stratégiai / mag / támogató folyamat | strategic / core / support process | classification by the effect on the goal |
| rendelésteljesítés | order fulfilment | a frequent starting point for the mapping |
| X-mátrix | X-matrix | Hoshin’s one-page visualization in the literature (Akao, Dennis) |
| stratégia-lebontási sablon | OGSM | the framework’s one-page, columnar tool |
What is policy deployment (Hoshin Kanri)?
A strategic decision-making framework that focuses resources on the key initiatives needed to achieve the company’s critical success factors: it breaks the strategy down along the key processes, and measures, controls and feeds back the results. Hoshin Kanri is the Japanese name for it.
What are the 6 steps of Hoshin?
(1) working out the critical success factors, (2) reviewing and defining the business metrics, (3) setting stepped improvement objectives for 1, 2, 3 and 5 years, (4) defining 4–10 key business processes, (5) deciding which process delivers to which target area, (6) selecting the processes that need detailed mapping.
What does catchball mean in strategy breakdown?
Cascading the goals and KPIs is not a one-way “drop” but a back-and-forth dialogue between the leader and the team, like throwing a ball. In the one-way drop the “ball falls,” meaning the cascade fails; the two-way catchball builds consensus and commitment. In the tug-of-war analogy: full force lines up behind a consensual goal, roughly half behind a forced one.
What is the difference between policy deployment and OGSM?
Policy deployment (Hoshin Kanri) is the framework: it tells you what we break down and onto what (critical success factors, key processes, stepped goals). OGSM is the tool: a one-page template that gives the form in which we hand the goal over from level to level (Objectives, Goals, Strategies, Measures). Without the framework the board is an empty formality; without the board the framework does not reach the shift.
When should I start with which, Hoshin or OGSM?
If it is not yet decided what you want to improve (there are no success factors, there are many parallel initiatives), start with the Hoshin questions. If the direction is clear but does not get down to the levels, start with OGSM. In normal operation the two run together, and MOS gives the rhythm of execution.
How many key business processes is it worth defining?
Between four and ten. Do not fall into the BPR trap, where 100+ processes are defined: brainstorm many, but agree on a few, so that the focus is preserved.
Related concepts
Section titled “Related concepts”OGSM · MOS · the performance board · the KPI cascade · the KPI/PI/I hierarchy · performance management · the 8 steps of Lean rollout · Lean leadership · VSM · PDCA
Next step
Section titled “Next step”If you have understood this, from here it is worth going on — in this order:
- OGSM — the framework’s one-page tool: what a tier-by-tier breakdown looks like in concrete terms, and what the “O and G are given, S and M are creativity” rule means. Start with this.
- MOS — the rhythm of execution: on which forum, at what frequency, the broken-down goal lives on in daily operation.
- the performance board — where the broken-down goal becomes visible to the team, and where the gap becomes the subject of a daily conversation.
References / Further reading
Section titled “References / Further reading”- Yoji Akao (ed.): Hoshin Kanri: Policy Deployment for Successful TQM. Productivity Press, 1991. — the canonical, English-language foundational work on Hoshin Kanri.
- Pascal Dennis: Getting the Right Things Done: A Leader’s Guide to Planning and Execution. Lean Enterprise Institute, 2006. — a practical, lean-minded introduction to policy deployment, with the catchball process.
- James P. Womack – Daniel T. Jones: Lean Thinking. Simon & Schuster, 1996. — the framework of the lean transformation, into which the strategy breakdown fits.