Visual management
≈ 17 min read · 3,357 words
You get into your car and a single glance tells you how much fuel you have, how fast you are going, whether the engine is running hot. You don’t have to read anything or do any arithmetic: the dashboard shows the good state and any deviation from it immediately, without explanation. The performance of a plant or an office can be made just as readable. That is what we call visual management (in Japanese 見える化, mieruka): we make the standard and any departure from it visible, so that anyone can see at a glance whether things are fine or someone needs to step in. Let’s look at what it is, why it works, and how it turns into real improvement.
Visual management is the use of visual devices that let anyone recognize the standard and any deviation from it at a glance. A good visual solution is self-explaining, self-regulating, self-improving and self-cleaning: it is understood on sight, it flags the deviation by itself, it prompts action, and it stays tidy. It is effective because we take in more than 80% of information visually, so a well-designed board or pictogram is understood regardless of language or reading ability. Measurement on its own, however, is not enough: the observation has to be turned into action.
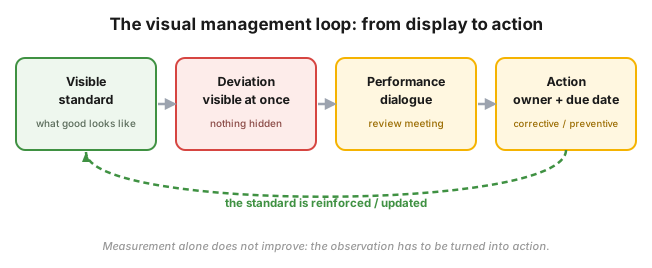 Figure 1 — the visual management loop: from the visible standard, through the immediately visible deviation and the performance dialogue, to the action that feeds back into the standard. The board is not the goal, it is what starts the loop.
Who is this for?
Section titled “Who is this for?”This article is for those who lead or follow daily operations visually as well: shift supervisor · plant manager · team leader · operator · process engineer · maintenance technician · HSE · reliability engineer · Lean/CI specialist.
Learning objectives
Section titled “Learning objectives”After reading this article you will be able to:
- state what visual management means, and why “the standard plus the deviation” is its essence;
- list the four properties of a good visual control, and give an example of each;
- explain why measurement alone is not enough, and how it turns into action;
- design a simple performance board and run a daily review meeting;
- draw the boundary: when the visual board is not the right answer.
In brief
Section titled “In brief”- Definition: visual devices (controls) that make the standard and any deviation from it visible at once.
- Four properties: self-explaining · self-regulating · self-improving · self-cleaning.
- >80% visual: a picture is faster and language-independent compared with text (think of the “no smoking” pictogram instead of a sign in a foreign language).
- Its tools: performance boards, dashboards, whiteboards with target values, a standardized inspection route, the safety cross.
- Few, balanced metrics: at most 5–6 KPIs per level, with clear target values; “the dialogue is what matters”.
- Measurement alone is not enough: the deviation has to produce an action in a performance dialogue, with an owner and a due date.
What is visual management?
Section titled “What is visual management?”Visual management is making the standard and the deviation visible, so that anyone can recognize at a glance whether the process is fine or an intervention is needed. It is neither decoration nor reporting: the point is that the good state and the departure from it can be read off together, immediately, without explanation. In the classic Lean formulation, visual devices are what allow “an individual to immediately recognize the standard and any deviation from it”.
Without two things, visualization does not work: you need an unambiguous standard (what is good?), and you need the visibility of the deviation (are we departing from it right now?). If there is no standard, “deviation” has no meaning; if there is a standard but it stays hidden, nobody steps in on time.
Why does it matter? (the stakes)
Section titled “Why does it matter? (the stakes)”In a plant, information is generated every moment: temperature, yield, scrap, a missed check. If that information is not visible, then either nobody notices the deviation, or it only comes to light when it is already expensive: in a shutdown, a quality complaint, a near miss. The stakes of visual management are that the deviation should be visible when it arises, on the spot, while intervening is still cheap and safe.
The common trap is not that there is no data, but that there is data and no action comes of it. The dashboard (Figure 2) is a good analogy: the light comes on, but if nobody looks at it or does anything, the engine is ruined all the same. The board on its own does not improve anything, it only makes things visible; the value comes from the dialogue and action that follow.
Why it works: more than 80% is visual
Section titled “Why it works: more than 80% is visual”More than 80% of human information intake is visual, which is why a picture “gets through” faster and more reliably than text. A good example is the “no smoking” sign: a notice in a foreign language (Greek, Italian) tells a traveller nothing, but the pictogram of a crossed-out cigarette is understood immediately by anyone, in any language. The same principle drives visualization in the plant: a green/red band on an instrument, a marked valve position, a colour-coded board can be read regardless of language or training.
That is why it pays to translate important information into a picture, a colour, a place, rather than into a long written report: what can be seen at a glance really will be seen.
What makes a good visual control? The four properties
Section titled “What makes a good visual control? The four properties”A visual solution is strong when four properties hold for it at the same time. Together they decide whether a board stays “alive” or dies off.
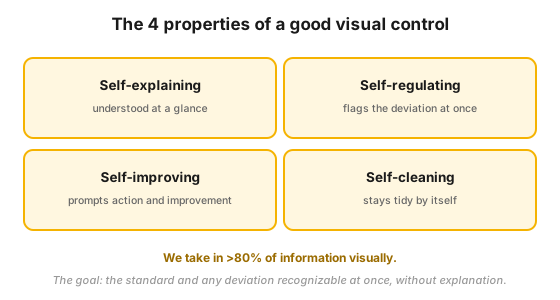 Figure 3 — the four properties of a good visual control. The aim is that the standard and any deviation are recognizable at once, without explanation.
| Property | English | What it means |
|---|---|---|
| Önmagyarázó | self-explaining | anyone understands the standard on sight, without a caption or training |
| Önszabályozó | self-regulating | it flags the departure from the standard immediately |
| Önjavító | self-improving | it prompts action and improvement, it does not merely inform |
| Öntisztító | self-cleaning | it is simple to maintain and stays tidy by itself |
If a board only manages the first of these (it is visible, but it does not flag anything, does not prompt anything and is hard to maintain), it is a poster rather than a visual control.
How does a display turn into real improvement?
Section titled “How does a display turn into real improvement?”Visual management works when the display turns into action. Visual performance management shows KPIs together with their target values on performance charts, dashboards and whiteboards (see performance board). Visualization becomes effective under three conditions:
- it is simple and intuitive (if it is not self-explaining, nobody looks at it);
- the people doing the work introduce and maintain it, rather than receiving it from above;
- it supports a robust performance dialogue (review meeting).
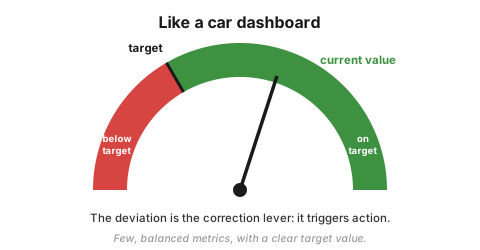 Figure 2 — the performance board is like a car dashboard: it measures the current value against the target, and the deviation is the “correction lever” that triggers action. Few, balanced metrics, with clear target values.
Two proven rules of thumb for the design: at most 5–6 metrics per level, because too many KPIs take away the focus; and “the dialogue is what matters”, meaning that what counts is not how handsome the board is, but that the team stands in front of it, interprets the deviation together and decides on the next step. The goal is therefore not the display, but that the deviations produce corrective and preventive actions. Measurement on its own improves nothing.
The standardized inspection route (visual operations)
Section titled “The standardized inspection route (visual operations)”The plant-floor extension of visual management is the standardized inspection route: the operator walks a fixed, visually marked round, touching the measuring points and the critical points in a defined order. At every point the visual standard (green/red band on the instrument, marked valve position, colour code) shows immediately whether the state is fine. This way the deviation is not lost during the shift, and the check becomes repeatable and impossible to skip. This is the idea that connects visual management to the standard operator round and to the gemba walk: all of them do the same thing, they make the actual state visible where the work happens.
Process-industry context and safety
Section titled “Process-industry context and safety”In a plant environment, visual management makes departures from safety, production and reliability standards immediately recognizable on shift boards (broken down by day and by hour). The immediate visibility of a deviation supports fast intervention and safe operation: the operator does not learn from a report at the end of the shift that a parameter has drifted, but on the spot, while something can still be done about it.
Typical visual devices in a plant:
- the safety cross (every day of the month is a field, green = a day without an event), which makes safety performance visible at a single glance;
- the performance board with the daily production and reliability KPIs and their target values;
- colour-coded bands, marked valve and switch positions, shadow boards for tools.
Putting it into practice (roadmap)
Section titled “Putting it into practice (roadmap)”Introducing a visual board is not a graphic design task but a leadership routine. A proven sequence:
- Choose the few important metrics (at most 5–6 per level) that genuinely measure the performance and health of the area, and assign a clear target value to each.
- Design the board together with the team: make it simple, self-explaining, with green/red logic, so that the deviation is visible on sight.
- Put it out on the gemba, where the work happens and where the team walks past it every day.
- Hold a regular, short review meeting in front of the board: what is off, why, who will fix it and by when.
- Close the loop: track the actions, and build the proven solution into standard work so that it lasts.
Hands-on — performance board workshop
Section titled “Hands-on — performance board workshop”A concrete exercise you can run today. The shift supervisor decides to introduce a performance board in the plant and to support it with daily review meetings. Roles within the team:
- one team leader, who runs the review meeting;
- one plant manager, who observes, gives feedback and challenges;
- everyone else takes part in the review as members of the shift.
The group’s task is twofold: (1) design a performance board (which 3–5 metrics, with what target values, with what green/red logic), and then (2) prepare and hold the daily review meeting with the team. The exercise teaches exactly what matters: the board is worth something only if conversation and action are built on it.
Measurement / audit
Section titled “Measurement / audit”Visual management is not an end in itself, so its effect is measured by the actions, not by the number of boards. A few good indicators:
- The share of deviations that trigger an action, and their closure: how many of the deviations seen turned into an action with an owner and a due date, and whether those were closed on time.
- The cadence and quality of the review meetings: whether the daily/weekly dialogue is actually held, and whether real decisions come out of it.
- Whether the board is “alive”: whether the data is up to date or stale (the practical test of the self-cleaning property).
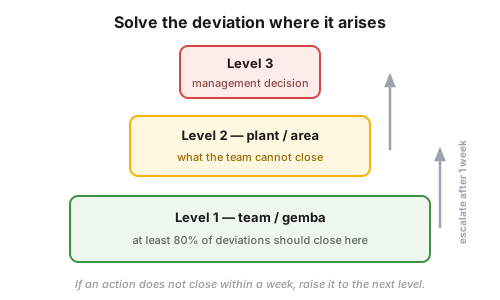 Figure 4 — escalation logic: deviations should be solved where they arise. At least 80% of cases should be closed at team (gemba) level; if an action does not close within a week, you raise it to the next level.
The escalation rule from the source is clear: at least 80% of deviations should be solved there, at team level, where they arise; and if an action does not close within a week, it is time to raise it to the next management level. This keeps the decision close to the problem, and stops open items from quietly dying off.
Common mistakes
Section titled “Common mistakes”Every mistake is worth looking at paired with the correct practice:
- Display without action. The board becomes “decoration” if there is no review and no owner behind it. Instead: every board should have a regular dialogue, an owner and a due date attached to it (close the loop, Figure 1).
- Too many metrics. A crowded board loses the focus. Instead: at most 5–6 balanced KPIs per level, with clear target values.
- Visualization that is too complicated. What is not self-explaining does not get looked at. Instead: simple, intuitive green/red logic, so that it can be read at a glance.
- A board imposed from above. If the people doing the work do not maintain it, it goes stale and loses credibility. Instead: the team designs and looks after the board (the mieruka is theirs, not the manager’s).
- “Deviation” without a standard. If there is no unambiguous standard, deviation has no meaning either. Instead: first fix the standard and the target value, and only then measure the deviation.
When NOT to use it? (limits of the method)
Section titled “When NOT to use it? (limits of the method)”Visual management is strong, but it is not the right answer to every problem:
| Situation | Why the visual board is not enough | The right answer | |
|---|---|---|---|
| There is no underlying standard/target | a deviation exists only relative to a standard | standardize first ([[standard-munka.en | standard work]]), visualize afterwards |
| A safety-critical protective function is needed | a colour code is not certified, audited protection | design per SIL/LOPA, IEC 61511 | |
| A complex problem with an unknown root cause | the board shows the symptom, it does not solve it | structured problem solving (A3, PDCA, [[5-miert.en | 5 Whys]]) |
| A rare, one-off event | there is no recurring routine worth visualizing | one-off analysis, recording the lesson |
Rule of thumb: visual management is strongest for performance that is watched regularly and measurable against a standard. The solution does not replace the intervention itself, it only makes it visible that an intervention is needed.
Take it home (keys)
Section titled “Take it home (keys)”- Standard + deviation: the essence of visual management is that the good state and the departure from it are visible at a glance.
- Four properties: a good visual control is self-explaining, self-regulating, self-improving and self-cleaning.
- Measurement does not improve, action improves: every board needs a dialogue, an owner and a due date.
- Few metrics, clear targets: at most 5–6 KPIs per level; a crowded board loses the focus.
- The board belongs to the team: they design and look after it, otherwise it goes stale and loses credibility.
- Solve it where it arises: 80% of deviations should be closed on the gemba; whatever does not close within a week, escalate.
Self-test
Section titled “Self-test”- Why do we say that “measurement alone is not enough”, and what does it take for the board to produce real improvement?
- List the four properties of a good visual control, and give a plant example of each.
- In a plant, every instrument panel has 15–20 metrics posted on it, and yet nothing happens about the deviations. Based on two proven rules, what would you change?
How does this show up in digital practice?
Section titled “How does this show up in digital practice?”The principle of visual management does not stop at the physical whiteboard: the same logic is realized in software too. Instead of a drawing pin and a coloured marker, here a live dashboard, automatic colour coding and alerting make the standard and the deviation visible; the mechanism differs, the principle is the same.
| Visual principle | Digital implementation | What it adds |
|---|---|---|
| Making the standard + target visible | live KPI dashboard with target bands | always up to date, not hand-drawn |
| Self-regulating (flagging the deviation) | automatic green/red colour code, threshold alerting | the deviation jumps out by itself, you don’t have to look for it |
| Self-cleaning (stays up to date) | automatic data collection (historian, machine signal) | no stale, manually refreshed board |
| From display to action | logged action with an owner, a due date and escalation | the observation becomes a trackable task |
| Inspection route | mobile, digital operator round with mandatory points | the round cannot be skipped and is auditable |
Connection to OPEREX (shift log)
Section titled “Connection to OPEREX (shift log)”The data behind the visual board and the actions agreed at the review meeting held in front of it can also be recorded in the shift log (OPEREX), so that the decisions and owners attached to the deviations seen live at the board leave a durable, auditable trail. The visual moment (a red field lighting up, a KPI drifting off) becomes a lasting document: it is recorded who saw it, what they decided, who owns it and until when, and even the escalation of an action not closed within a week can be tracked. This also provides an ISO 45001 audit trail showing that critical deviations really did produce an intervention.
Terminology (HU / EN / JP)
Section titled “Terminology (HU / EN / JP)”| Hungarian | English | 日本語 / note |
|---|---|---|
| Vizuális menedzsment | visual management | 見える化 (mieruka) — “making visible”; 目で見る管理 (me de miru kanri) — “management by sight” |
| Vizuális kontroll | visual control | a self-explaining device that shows the standard and the deviation |
| Önmagyarázó / önszabályozó / önjavító / öntisztító | self-explaining / self-regulating / self-improving / self-cleaning | the four properties of a good visual control |
| Teljesítménytábla | performance board | KPI + target value, visually |
| Ellenőrzési útvonal | control / inspection route | a standardized, visually marked round |
| Teljesítmény-dialógus | performance dialogue | the review meeting in front of the board (“the dialogue is what matters”) |
What is visual management in Lean?
The use of visual devices (boards, dashboards, colour codes, pictograms) that allow anyone to recognize the standard and any deviation from it immediately, without a caption or a separate explanation.
Why is visual management effective?
Because people take in more than 80% of information visually: a well-designed board or pictogram makes the standard and the deviation recognizable at once, regardless of language or reading ability (think of the “no smoking” pictogram instead of a sign in a foreign language).
What does a good visual control look like?
It is self-explaining, self-regulating, self-improving and self-cleaning: understood on sight, it flags the deviation by itself, it prompts action, and it stays tidy and up to date, without anyone having to explain it.
Is it enough to put up a KPI board?
No. Measurement on its own does not improve anything; the deviation has to produce an action in a regular performance dialogue (review meeting), with an owner and a due date. The board is the display; the value comes from the conversation and the intervention that follow.
How many metrics should a board carry?
At most 5–6 balanced metrics per level, with clear target values. Too many KPIs take away the focus and make the board unreadable, and therefore easy to ignore.
Related concepts
Section titled “Related concepts”performance board · performance management · performance dialogue · KPI definition · standard work · safety-cross · gemba-walk · the standard operator round · shift handover
Next step
Section titled “Next step”If you have understood this, from here it is worth going on, in this order:
- performance board — how the performance board, the most common tool of visual management, is built up in practice.
- performance dialogue — the mechanics of the review meeting in front of the board: this is how the display turns into action.
- standard work — the standard, without which there is no meaningful deviation, and into which you build back the proven solution.
References / further reading
Section titled “References / further reading”- Michel Greif: The Visual Factory: Building Participation Through Shared Information. Productivity Press, 1991 — the classic foundational work on the visual factory and shared information.
- Gwendolyn D. Galsworth: Visual Workplace, Visual Thinking. Visual-Lean Enterprise Press, 2005 — a systematic methodology of the visual workplace.
- Hiroyuki Hirano: 5 Pillars of the Visual Workplace. Productivity Press, 1995 — the connection between the visual workplace and 5S.