KPI cascade — breaking targets down across organizational levels (OGSM What/How)
≈ 24 min read · 4,732 words
The board sets a target: cut the site’s energy intensity. That number, however, lives in a strategy document, while the real improvement is delivered by the panel operator in the control room when they hold a furnace’s excess air on target. Who tells that operator how their knob relates to a board decision? The KPI cascade is exactly that missing link: the mechanism that breaks the top business objective down, step by step, until every role sees its own, influenceable metric and knows how it contributes to the target one level up.
The KPI cascade is the mechanism that breaks business objectives down into performance indicators (KPIs) at every level of the organization, level by level. Each level aggregates and drives the next, and it follows the “What/How” logic of OGSM: at every level the What (Objective + Goal) is paired with the How (Strategy + Measure), and the key rule is that the How of the upper level (Strategy & Measure) becomes, word for word, the What of the level below (Objective & Goal). This is how a business objective decomposes all the way down to equipment level (top-down) while actuals add up in the other direction (bottom-up) in one coherent performance chain — and how the target figures on the performance boards end up identical to the figures in the OGSM.
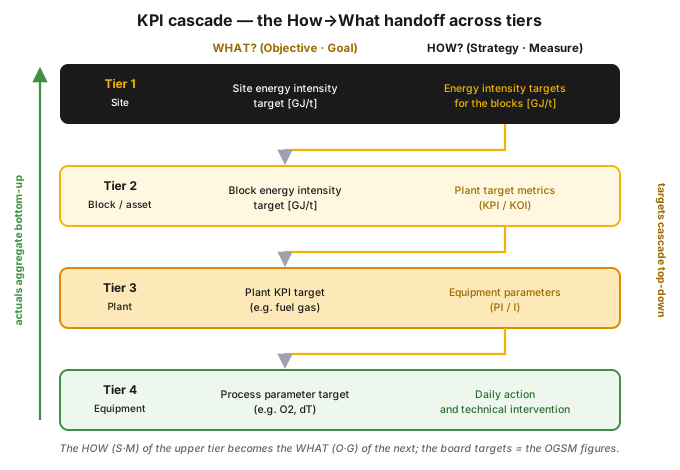
Figure 1 — the KPI cascade across four tiers. The left column is the What (Objective · Goal), the right one the How (Strategy · Measure). The amber arrows show the key handoff: the How of one level becomes the What of the next. Targets decompose top-down, actuals aggregate bottom-up.
Who is this for?
Section titled “Who is this for?”This article is for anyone who sets, breaks down or is held accountable to targets in practice: plant and block manager · asset team / reliability manager · process engineer · shift supervisor · panel and field operator · controlling / performance management · HSE · Lean/CI specialist.
Learning objectives
Section titled “Learning objectives”After reading this article you will be able to:
- explain what the “What” and “How” logic of the cascade means, and where the four OGSM elements (O · G · S · M) fit in;
- apply the tier rule: why the How of the upper level becomes the What of the next;
- set a target within the cascade along SMART principles, keeping the owning group’s influence in mind;
- justify why the target figure on the performance board must match the figure in the OGSM;
- recognize when the cascade is NOT the right answer (a metric nobody can influence, missing bottom-up validation).
In brief
Section titled “In brief”- The KPI cascade = running the tier system of OGSM at KPI level. Top-down targets are set on the focus KPIs selected at the upper level, then broken down to the lowest level, while actuals from the lower levels aggregate bottom-up.
- The key rule: “At Tier 2, the What (Obj. & Goal) is the How of Tier 1 (Strat. & Measure).” The How of one level becomes the What of the next, and that is what ties the corporate objective to shift-level action in an unbroken chain.
- Four (or more) tiers: Tier 1 (business / site), Tier 2 (block / asset team), Tier 3 (plant), Tier 4 (equipment). The KPI–PI–I indicator depth is covered in a separate article: KPI, PI, I.
- Targets are set along SMART principles within the cascade: the owning group must genuinely be able to influence the metric (Specific), it must be measurable and agreed (Measurable), challenging yet reachable (Attainable), realistic together with the actions that go with it (Realistic), and time-bound (Time-bound).
- Set top-down, validated bottom-up, calibrated against benchmarks. The upper level dictates the target; the lower level, the one that knows the process, validates whether it is realistic. Benchmarking (internal and external) calibrates the targets.
- The board target = the OGSM figure. “You must make sure that the target figures of the metrics on the performance boards are identical to the target figures in the OGSM and the business plan.” If they differ, two separate truths are born.
- The review rhythm is tiered: per shift or daily at the front line, weekly at block and plant level, monthly or quarterly at management level, with each level focusing on the KPIs of its own tier.
Why does it matter? (the stakes)
Section titled “Why does it matter? (the stakes)”What is at stake with the cascade is simple: an organization has either one truth or two. If the performance board carries the same target figure as the OGSM and the business plan, everyone pulls in the same direction and front-line action genuinely moves the corporate objective. If the board shows a different number from the strategy, the organization works to two separate truths, and the whole breakdown loses its point.
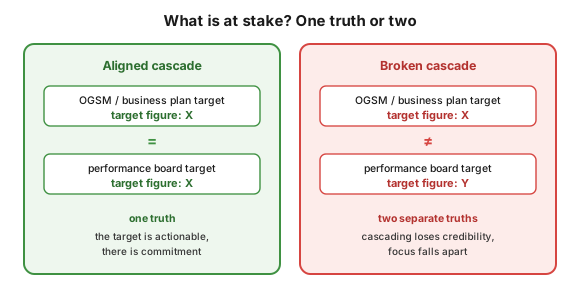
Figure 2 — what is at stake: if the board target matches the OGSM, there is one actionable truth; if it differs, two separate truths are born, and focus and commitment fall apart.
The symptoms of a badly cascaded (or uncascaded) organization are familiar from practice: “we talk about flow and pull, but I’m still rewarded for machine speed”; “everyone talked about change, but everyone carried on doing what was best for their own department.” These are not human failings but symptoms of a missing cascade: the top objective and the daily incentive are not linked in one chain. A good KPI cascade closes exactly that gap.
What does cascading mean? The “What” and the “How”
Section titled “What does cascading mean? The “What” and the “How””The KPI cascade is not a stand-alone method but the KPI-level projection of OGSM strategy deployment: the process by which business objectives are broken down into people and business performance indicators, and those indicators are reviewed. It is the first element of the “set direction & context” stage of performance management; here we focus on the breakdown itself.
In OGSM, every level has a What? and a How? part:
| Part | OGSM element | Type | Content |
|---|---|---|---|
| What? | Objective (O) | text | what we want to achieve |
| What? | Goal (G) | number | the target value belonging to the objective |
| How? | Strategy (S) | text | the chosen route to reaching the objective |
| How? | Measure (M) | number | how well the strategy is being delivered |
“The right KPIs are products of the What and How work” — a KPI is not an arbitrary metric but something derived from the Objective–Goal–Strategy–Measure logic of that level. The Goal is the target figure attached to the objective; the Measure is not another target but a gauge of how well we are executing that particular strategy.
How does the tier rule work? The engine of the cascade
Section titled “How does the tier rule work? The engine of the cascade”The cascade rests on a single, repeatable mechanism: the how of the upper level becomes the what of the level below. This rule is what links the corporate vision and daily action at equipment level in an unbroken chain.
The Strategy and Measure elements of the upper tier (its How) are copied word for word into the Objective and Goal slots of the tier below (its What). Put differently: at Tier 2, the What (Obj. & Goal) is the How of Tier 1 (Strat. & Measure).
The four tiers, in the process-industry energy example:
- Tier 1 — business / site level. The top objectives and goals (for example the site’s energy intensity). Here the strategy/measure means the energy intensity targets handed to the blocks.
- Tier 2 — block / asset team level. The Tier 1 block targets arrive here as objective/goal; the block generates its own strategy/measure against them, which yields the target metrics of the plants (KPI / KOI).
- Tier 3 — plant level. The plant KPI target (for example the fuel gas consumption of a given unit) is the objective/goal; the strategy/measure that goes with it is the target for the equipment parameters (PI / I).
- Tier 4 — equipment level. The process parameter target (for example furnace O2 content, temperature difference) is the objective/goal; here the strategy/measure is daily action and technical intervention.
In practice the breakdown can be finer. One of the energy breakdowns in the sources runs from Tier 1 site down to Tier 6 parameter: site → block → energy type → plant → equipment/subsystem → parameter. What matters is not the exact number of levels but that every role can see how it contributes to the target one level up, and knows who to aggregate to.
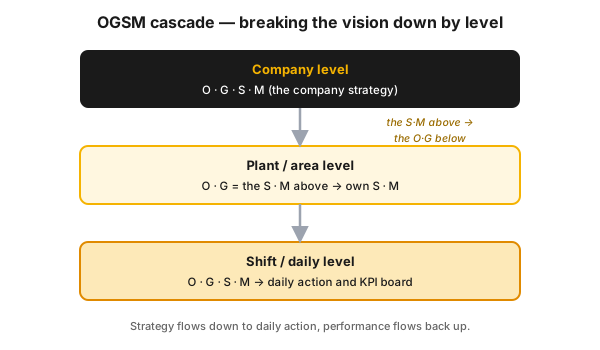
Figure 3 — the same What/How handoff in the language of OGSM: the Strategy & Measure of the upper level becomes the Objective & Goal of the level below, all the way down to daily action at shift level (see ogsm).
Top-down target setting, bottom-up aggregation
Section titled “Top-down target setting, bottom-up aggregation”The cascade runs in both directions. Downwards, management selects the focus KPIs and sets top-down targets on them, which are then broken down to the lowest level; targets should be stretching in the interest of continuous improvement. Upwards, every level aggregates the one below it: the detailed metrics of the operator and the shift (callouts, overtime, rework, daily PM status, productivity per shift) add up into the consolidated KPIs at plant and management level (unit-level productivity %, availability). This is how a top-level availability or energy intensity target can be traced back to daily shift-level activity, and how the cause of a deviation can be followed down to the level that owns it.
The breakdown can go all the way to the individual level: the individual, measurable targets of shift workers also cascade from the relevant business objective (“Targets are cascaded down from relevant business goals”), while still focusing on individual development. The block-level targets (HSE performance, energy intensity, availability, maintenance cost) are taken over from the figures of the site “one pager,” complemented by focus-area targets aimed at building competence.
How do you set a SMART target within the cascade?
Section titled “How do you set a SMART target within the cascade?”Goal and measure figures cannot be set arbitrarily: at every level they must be set along SMART principles, specifically from the perspective of the owning group and the cascade. SMART here is not the usual generality — it is about ownership of the metric:
| Letter | Meaning | Reading it through the cascade |
|---|---|---|
| S — Specific | specific | The owning group of that board / level genuinely has influence over the metric (it can be influenced and acted on). |
| M — Measurable | measurable | It is measurable, and the way it is measured is agreed and accepted by the group. |
| A — Attainable / Achievable | attainable | Challenging enough, yet reachable. |
| R — Realistic / Results-oriented | realistic / results-oriented | The group considers it realistic, together with the actions it has to take to reach the target. |
| T — Time-bound | time-bound | A given deadline for executing the action and reaching the target. |
“Specific” is the crucial one here: a good KPI is influenceable by the front line, which is also why it should preferably be a non-financial, forward-looking (leading) metric — financial results only measure after the fact, when intervention is no longer possible. “Realistic” is not only about the number either: a target is realistic when the actions behind it are realistic too. Targets are calibrated by benchmarking (internal and external), and success is worth celebrating with the team.
How does it connect to the performance board and the review rhythm?
Section titled “How does it connect to the performance board and the review rhythm?”The cascade is alive only when the targets handed down also appear on the physical stage, on the performance board, with the identical value. This is the test of the cascade’s integrity:
“You must make sure that the target figures of the metrics on the performance boards are identical to the target figures in the OGSM and the business plan.”
If the board target differs from the OGSM figure, the organization works to two separate truths and the breakdown loses its point (see Figure 2). That is why every level tracks its metrics as target ↔ actual, colour-coded.
Tracking and review run with a different tool and rhythm at each level (following the process-industry example in the sources):
| Level | Typical tracking tool | Review rhythm |
|---|---|---|
| Tier 1 — business / site | block and plant reports, dynamic reports | monthly / quarterly management meeting |
| Tier 2 — block / asset team | dynamic reports, SEMAFOR | weekly |
| Tier 3 — plant | plant report, whiteboard, SEMAFOR | daily performance meeting |
| Tier 4 — equipment / panel operator | whiteboard, dedicated DCS screen | per shift / continuous |
The higher level looks less often and with a more strategic focus; the front line looks every shift, because there the root cause of a problem would already be forgotten by the next day. This tiered rhythm is what ensures problems are handled at the immediate level: the rule of thumb is that at least 80% of issues should be resolved where they arise, and anything not resolved within a week must be escalated to the next tier (see performance board).
Process-industry context and safety
Section titled “Process-industry context and safety”In a reliability-driven process-industry plant, the cascade is what connects the strategic objective to metrics at the technical working level. Two characteristic applications and one safety emphasis:
1) Energy cascade. The Tier 1 objective is to improve the site’s energy intensity (goal: an energy intensity target [GJ/t]). This breaks down to the blocks (energy intensity targets [GJ/t] for the distillation block, the motor fuel production block, the reformer block), then to plant and equipment level, where the concrete instruments of the strategy appear: reducing fuel gas, steam and electricity consumption, furnace operating parameters, excess air / O2 content, heat exchanger condition. The panel operator therefore sees their own, influenceable indicator (for example the fuel gas consumption or the flue gas O2 content of one furnace), which traces back up to the site target. (The concrete internal target figures are company-confidential; they are treated here as a generic example, in units of energy intensity [GJ/t], not as a benchmark.)
2) Reliability / maintenance cascade. The strategic availability target (plant availability [%]) breaks down along the chain of roles: unit manager → reliability manager → maintenance supervisor → reliability engineer → maintenance team lead → planner → maintenance craft. At the top sit consolidated metrics (availability/reliability, productivity, FTE vs. target, losses vs. target), further down increasingly concrete ones: PM compliance by plant, maintenance backlog by craft, work order lead time, planning accuracy, callouts and overtime per shift. The cause of unplanned downtime can thus be traced down to the level that owns it, together with the quality of the RCA.
How do you introduce it? Roadmap
Section titled “How do you introduce it? Roadmap”A cascade is best built with focus rather than all at once. A shift supervisor or an asset team can start with the following steps:
- Select the focus KPIs at the upper level (following the “vital few” principle: a small, balanced set of metrics, not everything that can be measured). These are the ones you set top-down targets on.
- Break them down tier by tier with the What/How rule: the How of each level (Strategy & Measure) becomes the What of the next (Objective & Goal), until you reach an influenceable indicator at equipment or shift level.
- Validate every target bottom-up with the level that knows the process: is the number realistic, are the actions behind it realistic. Benchmarking (internal and external) calibrates the target.
- Fit it to the performance board with the same target figure as the OGSM and the business plan, tracked as colour-coded target ↔ actual.
- Set the tiered review rhythm (per shift at the front line, weekly at the block, monthly at management level), and fix the escalation rule: whatever is not resolved within a week goes to the next tier.
- Standardize it (standard work): write the proven practice that holds the indicator on target into an SOP, and make it visible on the whiteboard and the DCS screen.
Hands-on / mini-scenario
Section titled “Hands-on / mini-scenario”An exercise for a shift supervisor. Pick a site target that your team influences (for example energy intensity). Sketch the four tiers on a sheet of paper and fill in the O · G · S · M set for each, so that the S·M of the upper level is the O·G of the level below. The bottom row must hold a concrete indicator that your panel can adjust (for example the flue gas O2 content of a furnace). If what remains in the bottom row is a metric the shift has no influence over, the cascade broke one level higher up: find out where.
Measurement / audit
Section titled “Measurement / audit”The quality of a cascade is measured not by the number of metrics but by the soundness of its links. Auditable signs:
- Target match: does every target figure on the performance board match the figure in the OGSM and the business plan (the single most important test).
- Influenceability: does the owning group have influence over every metric at the lowest level (SMART “Specific”).
- Two-way flow: can every top KPI be traced down to the lower indicators that aggregate into it, and does every lower indicator have an owner upwards.
- Rhythm: does each level run the review appropriate to its tier, and does escalation work (an unresolved issue moves up within a week).
Common mistakes
Section titled “Common mistakes”Anti-patterns and the correction that goes with each, tied back to the article’s own claims:
- The board and the OGSM drift apart. The target value on the performance board does not match the OGSM figure. Why it hurts: two separate truths are created and the breakdown loses credibility. Instead: the same target figure on the board, in the OGSM and in the business plan (the left-hand side of Figure 2).
- Top-down imposition only, with no validation. The upper level dictates the target, but the level that knows the process never validates it. Why it hurts: the target stays unrealistic and there is no commitment. Instead: bottom-up validation and benchmarking for every target.
- A KPI the front line cannot influence. The metric violates the “Specific” element of SMART. Why it hurts: there is no action to take on it, and it becomes a pseudo-cascade. Instead: a leading metric at the lowest level that the owning group can influence.
- A financial, lagging metric at the end points. Financial results only measure after the fact. Why it hurts: by the time it shows, intervention is no longer possible. Instead: a forward-looking (leading), actionable metric at the bottom of the cascade.
- Confusing Strategy and Measure. The measure is not another target but the gauge of how the strategy is delivered. Why it hurts: whoever confuses the two builds a double target system. Instead: the Measure gauges how well we are executing that particular strategy.
- Too many, unbalanced metrics. Why it hurts: the “track the vital few” principle is broken and the cascade becomes impossible to read. Instead: a small, balanced set of focus KPIs per level.
- Dropping half of the SMART “Realistic.” The target figure is realistic, but the actions behind it are not. Why it hurts: the number stays out of reach. Instead: the target figure and the action plan are SMART together.
- One-way thinking. Breaking down alone, or aggregating alone, is not enough. Why it hurts: the chain never closes. Instead: targets decompose downwards AND actuals aggregate upwards.
When NOT to use it? (limits of the method)
Section titled “When NOT to use it? (limits of the method)”The KPI cascade is a strong framework, but it does not fit every situation. Sometimes another tool is the right answer:
| Situation | Why the cascade is not (primarily) the answer | What the right answer is |
|---|---|---|
| The metric cannot be influenced at the lowest level | there is no action to take on it, the number only holds people to account instead of driving them | find a leading indicator owned by that level, or push the metric one level up |
| A one-off, non-recurring problem | there is nothing to measure and cascade on an ongoing basis | one-off root cause analysis (5 Whys, A3 report), with the lesson captured |
| A certified safety function is needed | KPI attention is not a protection layer | design per LOPA/SIL and IEC 61511; the cascade only adds management attention |
| The organization cannot yet measure that level | you can only cascade on data that exists and is reliable | build the measurement and data collection first, break it down afterwards |
| The target would split into too many metrics | the “vital few” is broken and the board becomes noisy | select the small, balanced set of focus KPIs |
Rule of thumb: the cascade is at its strongest for breaking down recurring, measurable, influenceable targets. Where a metric cannot be owned or cannot be measured, fix that first; where certified safety is required, the cascade complements but does not replace it.
Take it home (keys)
Section titled “Take it home (keys)”- One truth, not two: the board target must be identical to the figure in the OGSM and the business plan, otherwise the breakdown falls apart.
- The tier rule is the engine: the How of the upper level (S·M) is the What of the next (O·G). Repeat it until you reach an influenceable indicator.
- Top-down target, bottom-up validation: the upper level dictates, the lower level that knows the process says whether it is realistic; that is how commitment is built.
- The lowest metric must be ownable: SMART “Specific” and leading, so the shift can genuinely do something about it.
- The cascade runs both ways: targets decompose downwards, actuals aggregate upwards, and the cause of a deviation can be traced back to the level that owns it.
- Tiered rhythm: per shift at the front line, weekly at the block, monthly at management level; an unresolved issue escalates within a week.
Self-test
Section titled “Self-test”- What exactly does the rule “the What of Tier 2 is the How of Tier 1” mean? Work through an energy example from the site down to the equipment.
- Why must the target figure on the performance board match the figure in the OGSM? What happens if they differ?
- A shift supervisor wants to put “site EBIT” on the board as a KPI for the panel operator. Which SMART letter does this violate, and what would you put there instead?
How does this show up in digital practice?
Section titled “How does this show up in digital practice?”Breaking targets down does not stop at paper or whiteboard level: the same logic is delivered in software in a modern performance management system. Instead of manual re-typing and boards that drift apart, the target figure comes from one source and the actual aggregates automatically upwards. The mechanism differs, the principle is the same.
| Cascade principle | Digital implementation | What it adds |
|---|---|---|
| One truth (board target = OGSM) | the target figure propagates to every level from a single source (OGSM / strategy module) | the two separate truths disappear, there is no manual typo |
| Bottom-up aggregation | the metrics of the levels are aggregated by the system into the KPI above | management KPIs rest on real, traceable primary data |
| Influenceable indicator | every role sees its own filtered dashboard with its own metrics | the front line gets the actionable number that belongs to it |
| Target ↔ actual, colour code | the system automatically flags metrics below target (red) | the deviation is visible at once and prompts a comment and an action |
| Tiered review + escalation | the cadence and the escalation rule are coded into the workflow | an unresolved issue moves to the next level by itself |
| Auditable trail | every actual value, comment and action is recorded with a timestamp | the primary data of the cascade is retrievable and auditable |
Connection to OPEREX (shift log)
Section titled “Connection to OPEREX (shift log)”The lowest, shift-level layer of the KPI cascade (Tier 3 / Tier 4) “lands” where the shift actually works: daily, indicator-level metrics (fuel gas consumption, callouts, overtime, rework, daily PM status, process parameters against target). The OPEREX shift log is exactly this layer: the place where the shift records the actual values, the gaps against target, the mandatory comments attached to them and the actions triggered — time-stamped and auditable. This secures the most fragile point of the cascade, the creation and upward aggregation of primary data, by machine, in a closed loop: management KPIs rest on real, retrievable primary data, and the deviation from target is visible and escalatable shift by shift.
Terminology (HU / EN / JP)
Section titled “Terminology (HU / EN / JP)”| Hungarian | English | 日本語 / note |
|---|---|---|
| KPI-kaszkád | KPI cascade | breaking targets down across levels |
| kulcs teljesítménymutató | Key Performance Indicator (KPI) | the focus metric |
| (kulcs) működési mutató | (Key) Operating Indicator (KOI) | plant / operating level metric in the process-industry breakdown |
| teljesítménymutató | Performance Indicator (PI) | the metric broken down under the KPI |
| indikátor | Indicator (I) | the lowest, equipment / parameter level |
| Mit? | What? (Objective + Goal) | the target part |
| Hogyan? | How? (Strategy + Measure) | the delivery part |
| szint | tier | Tier 1 (business) … Tier 4 (equipment) |
| felülről lebontva | top-down (cascaded down) | setting the targets |
| alulról összegezve | bottom-up (aggregated) | aggregating the actuals |
| stratégia-lebontás | OGSM / Hoshin Kanri (方針管理) | the framework of the cascade |
| SMART cél | SMART target | Specific · Measurable · Attainable · Realistic · Time-bound |
| összehasonlító elemzés | benchmarking | calibrating the targets |
How do business objectives cascade into KPIs across organizational levels?
Through the tier system of OGSM. Every level has a What (Objective + Goal) and a How (Strategy + Measure). The key rule is that the How of the upper level (Strategy & Measure) becomes, word for word, the What of the level below (Objective & Goal), so the business objective decomposes all the way to equipment level while the actuals add up in the other direction.
What does "the What of Tier 2 is the How of Tier 1" mean?
It means that the strategy of the upper level and its measure (the how of delivery) become the objective and target figure of the next level (its what). The How of the upper level turns into the What of the lower one; this is the single, repeated engine of the cascade, and it forms an unbroken chain between the vision and the shift.
What does SMART mean for target setting within the cascade?
Specific (the owning group has influence over it), Measurable (measurable, with an agreed way of measuring), Attainable (challenging but reachable), Realistic (realistic together with the actions behind it), Time-bound (with a deadline). The target is set top-down, but validated bottom-up and calibrated against benchmarks.
Why must the board target match the OGSM figure?
Because if it differs, the organization works to two separate truths. The target values on the performance board must be identical to the target figures in the OGSM and the business plan; this is the test of the cascade’s integrity.
What is the difference between the KPI cascade and the KPI–PI–I breakdown?
The KPI cascade is about breaking down between organizational levels (who owns which target along the Tier 1 → Tier 4 chain). The KPI–PI–I breakdown is a depth breakdown of a single indicator within that (the performance and elementary indicators behind one KPI, an intervention tree); see it separately: KPI, PI, I.
Related concepts
Section titled “Related concepts”ogsm · performance management · performance board · KPI definition · KPI, PI, I · performance dialogue · visual management · pdca · shift handover
Next step
Section titled “Next step”Once you have this, these are the places to go next, in this order:
- ogsm — the full framework of strategy deployment, of which the KPI cascade is the KPI-level projection. This is where you see the Tier 1 objectives come from.
- KPI, PI, I — how a single KPI breaks down into a tree of the performance and elementary indicators behind it (the depth breakdown within the cascade).
- performance board — where and how the target handed down lives on the physical stage, with the tiered review rhythm and escalation.
References / further reading
Section titled “References / further reading”- George T. Doran: “There’s a S.M.A.R.T. Way to Write Management’s Goals and Objectives.” Management Review, 70(11), 1981. — the canonical, public source of SMART target setting.
- Robert S. Kaplan – David P. Norton: The Balanced Scorecard: Translating Strategy into Action. Harvard Business School Press, 1996. — the foundational work on translating strategic objectives into metrics and on the logic of cascading them across organizational levels.
- Yoji Akao (ed.): Hoshin Kanri: Policy Deployment for Successful TQM. Productivity Press, 1991. — the Japanese methodology of strategy deployment (policy deployment), a relative of OGSM and the cascade.