Performance Board and Performance Dialogue
≈ 23 min read · 4,652 words
The shift takes over the plant in the morning, and the first question is always the same: where are we against plan? A well-built board answers that at a glance: here is the target, here is the actual, this number is red, next to it a few words on why, and an action saying who does what about it. That is the performance board, and the short, focused conversation around it is the performance dialogue. Not a poster, not an information wall: it keeps performance management alive on the front line. Let’s look at what it is, what it is made of, and how you would introduce one tomorrow.
A performance board is a visual tool: it shows a process’s key metrics against target and serves the regular performance review. Its purpose is that anyone can immediately recognize the standard and any deviation from it, and that problems are prevented rather than corrected after the fact. The board is the arena of the performance dialogue: at the daily review the shift supervisor goes through actual vs. plan performance together with the team and starts joint problem solving, bringing performance management onto the front line. The board on its own is only a tool: the real goal is a working performance management system across the whole plant.
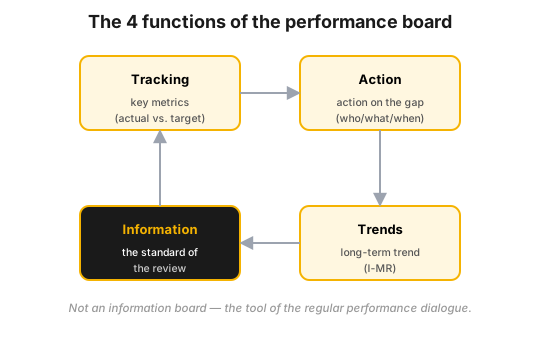 Figure 1 — the four functions of the performance board: Tracking and Trends show, Action intervenes, and Information records the standard of the review. The board is not an information wall, it is the tool of the regular performance dialogue.
Who is this for?
Section titled “Who is this for?”This article is for those who measure and steer performance day by day: shift supervisor · plant and production manager · operator · process engineer · Lean/CI specialist · reliability engineer · HSE · maintenance manager.
Learning objectives
Section titled “Learning objectives”After reading this article you will be able to:
- explain the dual function of a performance board, and how it differs from an information board;
- list the four main parts of the board (tracking, action, trends, information), and say what each is for;
- read the blue/red/green colour code correctly, and know when a value above target is good and when a value below it is;
- derive the 80% rule and the one-week escalation, and know when a problem has to be taken upward;
- outline the 6-step rollout on a pilot area, and run a first daily review.
In brief
Section titled “In brief”- The dual function of a performance board: tracking a few key metrics (the vital few) AND facilitating the regular performance review. It does not exist for its own sake, and it is not an information board.
- Four main parts: Tracking, Action, Trends, and Information (the standard of the meeting: frequency, location, participants, agenda, roles).
- Colour code: blue is the target, red means the actual did not reach the target, green means it did. Depending on the metric, either a value above the target (e.g. run speed) or below it (e.g. set-up time, downtime) is the good one.
- A good indicator set: few, balanced, SMART metrics, typically at most 5-6 KPIs per level, with clear targets, preferably non-financial and forward-looking (leading).
- “Own Your Numbers”: a number written up by hand creates ownership and forces thinking; measurement alone is not enough, observations have to be turned into action.
- The dialogue is what matters, not the board. KPIs are reviewed in a cascade (I → PI → KPI) across the whole organization, at different frequencies: per shift / daily on the front line, weekly / monthly / quarterly further up.
- The rollout has 6 steps (introduction → pilot selection → content → review structure → build and launch → improve), and a lot of time has to be invested before the payback comes.
Why does it matter? (the stakes)
Section titled “Why does it matter? (the stakes)”The stake is whether the improvement is sustained. Many improvement initiatives fail not on a bad idea but on weak performance management: however well a programme starts, it comes to nothing if afterwards nobody keeps an eye on the metrics, nobody gives feedback on them, and nobody follows up on actions.
The symptom shows up in sentences you will recognize from practice: “everyone talked about the change, but everyone carried on doing whatever was best for their own department”; “we talk about flow and pull, but we are still rewarded on machine speed and machine efficiency.” Where measurement and feedback disappear, the old routine comes back and the improvement you invested in evaporates.
A board that works, by contrast, makes performance management visible and unavoidable on the front line: it supports flow, reduces variation, and secures the sustainability of continuous improvement. The lesson is simple: the most expensive metric is the one nobody looks at.
What is it, and where does it come from?
Section titled “What is it, and where does it come from?”The performance board is one of the tools of visual management: a visual control that lets anyone immediately recognize the standard and any deviation from it. Behind it lies a simple observation: we take in more than 80% of information visually, so a well-built board communicates faster than a spreadsheet or a written report.
Performance management is part of Lean’s Management Infrastructure, and it is the main way an organization ensures it takes the right actions to execute strategy and create value. The framework has five elements:
- Defining clear metrics, targets and accountability.
- Preparing a realistic budget and plan.
- Tracking performance effectively.
- Holding a robust performance dialogue.
- Providing rewards, consequences and actions.
The performance board is the physical appearance of elements 3 and 4 on the shop floor. A useful analogy: performance management is like the dashboard of a car. There are performance indicators (current value vs. target value), and there are “correction levers”; watching the dashboard is not enough, you also have to steer.
The targets come from the OGSM (Objectives, Goals, Strategies, Measures) strategy deployment: the board’s target values must match the OGSM numbers. KPIs cascade level by level, with the S (Strategy) and M (Measure) elements of the upper level becoming the O (Objective) and G (Goal) elements of the level below. See: ogsm.
How does the performance board work?
Section titled “How does the performance board work?”A performance board works by displaying the key metrics of a process against target, by hand and colour-coded, by assigning an action to every deviation, by showing the long-term trend separately, and by putting the standard for running the review on the board as well. It has four main parts, and a handful of recurring principles behind it.
The three steps of “maintaining” a metric
Section titled “The three steps of “maintaining” a metric”- Find the optimal target value for the indicator.
- Standardize: write an SOP for the work tied to the metric.
- Track it on the board (whiteboard), by hand.
The KPI / PI / I breakdown
Section titled “The KPI / PI / I breakdown”The board carries not only outcome KPIs, but also the lower-level metrics that underpin them:
- KPI (Key Performance Indicator): a key metric, typically at management level.
- PI (Performance Indicator): a performance metric that drives a KPI.
- I (Indicator): a low-level indicator on the front line that can be influenced directly.
The Is and PIs underpin the KPIs above them, so every level manages the metrics it can actually influence. The marks of a good KPI: simple and easy to measure, actionable (it can be influenced), significant in its impact on the organization, typically non-financial, and often leading (forward-looking). Targets should be SMART:
| Letter | Meaning | On the board |
|---|---|---|
| Specific | concrete | the group owning the board can influence it |
| Measurable | measurable | the way it is measured is accepted within the group |
| Attainable | achievable | it is a challenge, but it can be met |
| Realistic | realistic | the group considers the target and the actions leading to it realistic |
| Time-bound | with a deadline | tied to a given date |
The four main parts of the board
Section titled “The four main parts of the board”1) Tracking. The current status of the vital few metrics. A good indicator is updated frequently (process and energy parameters hourly; maintenance and logistics per order), visual, makes the gap easy to see, and is relevant to the process. In line with the Lean goals, the areas tracked follow the SQDP logic:
- Safety: LTA count, minor accidents, near misses, hazardous events.
- Quality: internal and external complaints, defects, material loss.
- Delivery: OTIF, days of inventory, “overs/unders” (over- and under-production), schedule adherence.
- Productivity: run time, downtime, output, material loss.
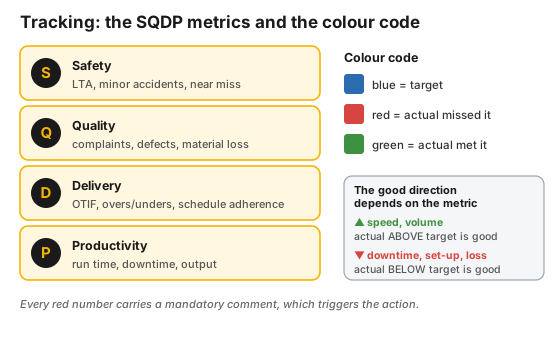 Figure 2 — the four areas of tracking (SQDP) and the colour code. Blue is the target, red means the actual falls short, green means it is met; the good direction depends on the metric, and every red number carries a mandatory comment.
The colour code is simple: blue is the target, red means the actual did not reach it, green means it did. For a metric where a higher value is good (speed, volume), the actual should be above the target; where a lower value is good (downtime, set-up time, loss), it should be below it. Every red number needs a mandatory comment explaining what happened and triggering the action (e.g. “the impression rollers are worn out”).
2) Action. The observation has to be turned into action; measurement on its own is not enough. First a containment (immediate) action, and only then problem solving aimed at the root cause (RCPS). The range of problem responses:
- Immediate action (~1 day): everyday, frequent problems arising during operation; basic RCPS, 5 Why, hypothesis tree. These can be handled at the board.
- Project / project plan (~1 week and beyond): design, process, engineering or quality problems; Six Sigma / A3 toolkit.
The principle: at least 80% of problems must be solved where they arise (machine, department, plant level). If the team cannot cope, it should use the existing systems for help (T-card, work order). Escalation: if any action is not resolved within one week, it has to be taken to the next level up. Actions should be clear and tied to an owner and a deadline, i.e. Who / What / When (e.g. “Bill B. / replace the impression rollers / 12.12.”).
3) Trends. The long-term change in the process output is shown by I-MR (Individuals–Moving Range) control charts, using the weekly averages of the most important metrics against the monthly target. This is what separates random fluctuation from a genuine trend.
4) Information (the standard of the meeting). A performance board is not an information board, but it does need the information required to run the review: purpose, objectives, duration, frequency, location, participants, inputs, outputs, ground rules and a general agenda. Without these the board does not facilitate the meeting, it only displays data.
How does the performance dialogue run?
Section titled “How does the performance dialogue run?”The board is the arena of the performance dialogue: together with the team, and focusing on the metrics falling short (red), the shift supervisor goes through actual vs. plan performance and starts joint actions that address the root cause. It is not a monologue but a shared working session: in a good dialogue the participants prepare in advance, argue from facts, and every action has a clear owner.
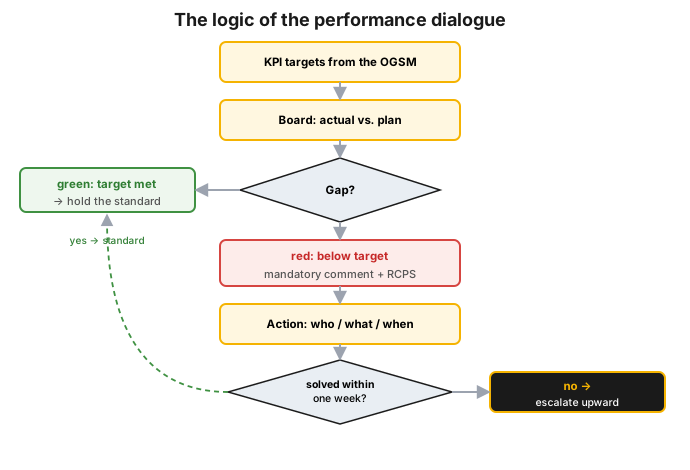 Figure 3 — the logic of the dialogue around the board: targets coming from the OGSM, the actual vs. plan comparison, a mandatory comment and root cause analysis on a deviation, an action with an owner and a deadline, then resolution within one week or escalation upward.
The marks of a “good dialogue”, the detailed set of dialogue questions, the review frequency by level, the 80% rule and the one-week escalation rule are covered in a separate, detailed article: → performance dialogue.
Process-industry context and safety
Section titled “Process-industry context and safety”In a process-industry environment the board is the backbone of shift-level performance tracking. Typical metrics: throughput [t/day], set-up / loading-arm time [minutes], downtime (UDT/UPDT), conversion loss, OEE, energy consumption [GJ/t] and the safety metrics. Process and energy parameters are updated hourly, maintenance and logistics metrics per order.
Separate boards live at each level, each with its own influenceable indicators, mirroring the OGSM/KPI cascade: for example a Refinery Performance Board (Tier 1), a Motor Fuel Production Performance Board (Tier 2), and an HDS / unit-level board (Tier 3). A Tier-1 OGSM objective set typically covers HSE (e.g. zero accidents), quality (complaints per year), delivery (OTIF), profitability (EBITDA, conversion cost, loss, inventory turnover), a motivated and skilled team, and reliable capacity.
One concrete process-industry KPI cascade (reliability/maintenance) shows the organizational depth: unit manager → reliability manager → maintenance supervisor → reliability engineer → maintenance team lead → planner → maintenance craft. From the top down, the metrics that underpin one another are the compliance of reliability initiatives, unplanned losses per unit, maintenance variance against budget, PM compliance, backlog, and work order cycle time.
A performance board is not a substitute for certified functional safety systems. Visual control is a tool for managing daily performance and routine deviations; protective and emergency shutdown logic must always be designed on the basis of risk analysis and the relevant standards (LOPA, SIL / IEC 61511).
Putting it into practice (roadmap: pilot → rollout)
Section titled “Putting it into practice (roadmap: pilot → rollout)”Introducing a performance board is a 6-step process, and the essence of it is ownership: the teams should build the board themselves, update it by hand, and keep it close to the equipment. A lot of time has to be invested before the first payback arrives.
- Introduce performance management and the board to the implementing team and to production management. The purpose and benefit of the introduction should be explained, but the introduction itself is not up for debate.
- Choose a pilot area (2-3 of them), preferably from the selected value stream, with teams that have a positive attitude, and identify the key stakeholders (operator, team leader).
- Define the content: a balanced, small set of metrics from the four main areas (safety, quality, delivery, performance), clearly linked to the KPIs above; do not track too many metrics.
- Build a review structure: a clear agenda, participants, roles, responsibilities, preparation, duration. Shadow the review often, especially at the start, and give feedback.
- Build, install and launch: the board should be built by the people who will use it, kept simple, updated by hand, and placed close to the equipment. Attention in the first weeks is critical.
- Improve: once the initial board works well, add metrics, train the team on RCPS tools, recalibrate the targets, and roll it out further with the lessons from the pilot.
The full, step-by-step recipe (with key points and the roles around the board) is in a separate article: → performance board rollout.
Hands-on (workshop)
Section titled “Hands-on (workshop)”One proven exercise can be run tomorrow:
- Roles: 1 team leader (runs the review), 1 unit manager (observes, gives feedback, challenges), everyone else is the crew.
- Task 1: build a performance board for an imaginary unit, with trends, targets, deviation notes and actions, using plenty of markings and highlights.
- Task 2: prepare and hold a daily review with the crew, applying the principles of tracking and visual management.
Mini-scenario (if there is no workshop): pick a painful metric from your own area (e.g. set-up time), write up the target and yesterday’s actual by hand, colour them (blue target, red/green actual), write a one-sentence comment on the red one, and assign a Who / What / When action to it. Tomorrow, start the shift at that same board.
Measurement / audit
Section titled “Measurement / audit”The “audit” of a performance board system can be read at two levels.
1) The board itself as an audit tool. By definition, visual control serves the immediate recognition of a deviation, so the red/green status is in itself a continuous visual audit against the standard. Measurable discipline metrics:
| Metric | Target | What it signals |
|---|---|---|
| Share of red deviations that carry a comment | 100% | the discipline of “every red has an explanation” |
| Share of actions with an owner + a deadline | high | whether the board is actionable, or merely data |
| “Solved on the spot” share | ≥ 80% | whether problems are solved at the level where they arise |
| Adherence to the escalation time | 1 week | whether an open action is getting stuck |
2) The quality of the dialogue. Reviews must be shadowed, especially at the beginning of the rollout, and feedback given. The “good dialogue” checklist can effectively be used as a set of audit criteria: active participation, advance preparation, grounding in facts, clear ownership of actions, disciplined follow-up on progress.
Sustaining. Define a re-assessment schedule for the standards and SOPs, run a gap analysis on performance against the procedures and on the training and development plans, handle deviations through troubleshooting, then introduce new improvements and retrain. Target values must be recalibrated periodically: the board is not static.
A practical example
Section titled “A practical example”Shift performance follow-up in a plant (sample metrics on a converting machine):
| Metric | Source report | Operational update | Management update |
|---|---|---|---|
| Set-up | production report / shift | every shift | monthly target (LLC) |
| Run speed | “slagen per neto uur” | every shift | monthly |
| UDT (downtime) | shift summary | every shift | monthly |
| Waste (loss %) | “afval %” | every shift | monthly |
Example of a tracking row (manual, colour-coded): in the Run speed row the target and the actual sit side by side; if the actual is below the target (red), a mandatory comment follows (“The impression rollers are worn out.”), then an action: Who / What / When.
Delivery (overs/unders) example: if scrap has gone up because of bad printing, a comment has to be written next to the red number so that it triggers an action aimed at eliminating the root cause.
Common mistakes
Section titled “Common mistakes”- Building an information board instead of a performance board. Why it hurts: data without an owner, a role and an action is just decoration. Instead: a target for every metric, a comment for every red, an action for every comment (owner + deadline). The board serves the dialogue, not itself.
- Too many metrics. Why it hurts: the “track the vital few” principle is broken and focus falls apart. Instead: typically at most 5-6 KPIs per level, balanced across the four areas.
- The root cause action never happens. Why it hurts: the symptom is treated, the cause remains, and a small issue keeps growing. Instead: containment first, then RCPS on the root cause, and follow-up on closing the action.
- A computer printout instead of writing by hand. Why it hurts: you lose the ownership and the “handwriting forces thinking” effect. Instead: update the board manually, by the team’s own hand.
- The board is in a remote, noisy or unsafe place. Why it hurts: it does not get used, and it is a safety risk. Instead: close to the equipment, in a safe and quiet spot.
- Someone other than the team builds the board. Why it hurts: there is no ownership, and it stays alien. Instead: it should be built by the people who will use it.
- A monologue instead of a dialogue. Why it hurts: passive participants, no preparation, no joint problem solving. Instead: advance preparation, facts, joint actions with a clear owner.
- The review turns into a problem-solving meeting. Why it hurts: the discipline and the agenda fall apart. Instead: the review looks at the gaps and the actions; deep problem solving belongs in a separate session.
- Attention drifts away from a board that already works. Why it hurts: the routine slips back and the board goes stale. Instead: continuous attention and coaching after the rollout as well, plus recalibration of the targets.
- The wrong frequency. Why it hurts: the front line needs real time or per shift, but chewing over strategic issues weekly is unproductive. Instead: frequency by level (per shift / daily at the bottom, weekly / monthly / quarterly at the top).
When NOT to use it? (limits of the method)
Section titled “When NOT to use it? (limits of the method)”A performance board is a strong tool for daily, recurring performance tracking and for handling routine deviations. There are cases where a different answer is the right one:
| Situation | Why (primarily) not the board | The right answer |
|---|---|---|
| A one-off, deep problem (non-recurring) | the board is made for a daily rhythm, not for one big, unique analysis | a dedicated A3 / Six Sigma project |
| A certified safety function is needed | visual control is not a certified protection layer | design per SIL/LOPA, IEC 61511 |
| A strategic issue on a daily rhythm | solving a strategic problem takes the long term, weekly “chewing” is unproductive | a higher-level, less frequent review (the OGSM cadence) |
| No ownership / it is put up under duress | a board that is not used is just decoration | ownership and review discipline first, the board only afterwards |
| Too many financial, lagging metrics | they are not actionable on the front line | a few influenceable, leading Is/PIs matched to the level |
Rule of thumb: a performance board is strongest on the front line’s influenceable, recurring metrics. For safety-critical protection, a one-off deep problem or a purely strategic question it does not replace the appropriate tool, it complements it.
Take it home (keys)
Section titled “Take it home (keys)”- Dual function: the board tracks (the vital few) AND facilitates a review. If either is missing, it is just an information wall.
- A comment for every red, an action for every comment (Who / What / When). Measurement on its own is not enough.
- 80% where it arises; escalation after one week. These two rules are what keep the actions moving.
- Own your numbers: a number written by hand, a board built by the team’s own hand, close to the equipment. Ownership is not optional.
- The dialogue is what matters, not the board. The board is a tool; the goal is a working performance management system.
Self-test
Section titled “Self-test”- What is the dual function of a performance board, and what turns a board into “just” an information board?
- A run speed metric is above target, a downtime metric is below target. Which one is green, which is red, and why does this depend on the direction of the metric?
- The action on a red deviation is not resolved within a week. What do the 80% and one-week rules require, and what is the next step?
How does this show up in digital practice?
Section titled “How does this show up in digital practice?”The logic of the performance board does not stop at the physical whiteboard: the same measure → deviation → action → closure cycle is also realized in software. The mechanism differs (a field, a workflow and an alert instead of a marker and a magnet), the principle is the same.
| Board principle | Digital implementation | The value |
|---|---|---|
| Tracking (a hand-written number) | automatic or structured data entry, a plan vs. actual view | always current, comparable status |
| Colour code / red comment | a mandatory justification field on a value that misses target | not a single red is left without an explanation |
| Action (Who/What/When) | an action item with an owner, a deadline and a status | open actions do not get lost |
| Escalation (1 week) | deadline monitoring, automatic reminder/escalation | a stuck action floats upward on its own |
| Trends (I-MR) | automatic trend/control chart from the historian | random fluctuation separates from a real trend |
| Information (the review standard) | a fixed agenda, participants, a log of the review | the dialogue is retrievable and auditable |
Connection to OPEREX (shift log)
Section titled “Connection to OPEREX (shift log)”The output of the daily review meeting and the shift handover (the safety topic, the previous day’s plan vs. actual, the deviations discussed, the actions assigned with an owner and a deadline) can be recorded in the OPEREX shift log in a structured, retrievable and auditable way. This means the SQDP metrics tracked on the board, the mandatory comments on red deviations and the actions decided are documented digitally; the manual whiteboard keeps its ownership (“own your numbers”) logic, while open actions can be followed from shift to shift at handover, and the escalation deadline (1 week) can be monitored by machine.
Terminology (HU / EN / JP)
Section titled “Terminology (HU / EN / JP)”| Hungarian | English | 日本語 / note |
|---|---|---|
| teljesítménytábla | performance board | a visual board on the shop floor |
| teljesítménydialógus | performance dialogue | the review conversation |
| vizuális menedzsment | visual management | 見える化 (mieruka) is a related principle |
| kulcsmutató | KPI (Key Performance Indicator) | PI = Performance Indicator, I = Indicator |
| követés / akció / trend / információ | tracking / action / trends / information | the 4 main parts |
| gyökérok-problémamegoldás | RCPS (Root Cause Problem Solving) | see A3/RCPS |
| azonnali elhárítás | containment action | comes before RCPS |
| eszkaláció | escalation | upward after 1 week |
| stratégia-lebontás | OGSM / Hoshin | 方針 (Hoshin), the Japanese root |
What is the difference between a performance board and an information board?
A performance board actively tracks the metrics and generates actions on deviations from target within a standardized review process, with owners and roles. An information board only passively displays data, with no owner, no role and no action. The principle: a performance board is not an information board.
What are the four main parts of a performance board?
Tracking, Action (the interventions), Trends (typically with I-MR charts) and Information (the standard of the meeting: purpose, duration, frequency, location, participants, agenda, inputs/outputs).
What do the colours on a performance board mean?
Blue is the target, red shows that the actual did not reach the target, and green that it did. Depending on the metric, the good value is either above the target (e.g. run speed, volume) or below it (e.g. set-up time, downtime, loss).
Who runs the daily performance review meeting, and who takes part?
The team leader holds the review along the KPIs, the unit or plant manager observes, gives feedback and challenges, and the members of the team take an active part in reviewing performance and in joint problem solving.
When does a problem have to be escalated?
At least 80% of problems must be solved where they arise (machine, department, plant level). If any action is not resolved within one week, it has to be taken to the next organizational level. Containment (immediate action) always comes first, and only then root cause analysis (RCPS).
Related concepts
Section titled “Related concepts”performance management | performance dialogue | the performance-board rollout | KPI definition | KPI cascade | KPI, PI, I | feedback | ogsm | mos | visual management | oee | pdca | 5s | shift handover
Next step
Section titled “Next step”If you have understood this, from here it is worth going on — in this order:
- performance dialogue — the conversation around the board: the marks of a “good dialogue”, the set of dialogue questions, the frequency by level and the escalation rule in detail.
- performance board rollout — the full, step-by-step recipe for the 6-step rollout, with the roles around the board.
- performance management — the broader system for which the board is the front-line appearance; here you see where the five elements and the OGSM fit in.
References / further reading
Section titled “References / further reading”- Robert S. Kaplan, David P. Norton: The Balanced Scorecard. Harvard Business Review Press, 1996 — the canonical work on target-driven, balanced metric sets and strategy deployment.
- Mike Rother: Toyota Kata. McGraw-Hill, 2009 — the daily routine, the target vs. actual comparison and coaching-based, iterative problem solving (the background to the performance dialogue).
- Jeffrey K. Liker: The Toyota Way. McGraw-Hill, 2004 — a comprehensive treatment of the principles of visual management and shop-floor leadership.