Operational Excellence (OE)
≈ 31 min read · 6,258 words
Two plants make the same product with the same technology. In one, the shift knows at seven in the morning where the plan stands, what broke overnight, and who does what about it today. In the other, they find the same thing out on Tuesday, in a meeting, from spreadsheets that contradict each other. Within a few years the first plant runs with fewer accidents, higher utilization and half the maintenance bill — even though its equipment is identical. The difference is not the steel, but the way of operating: the system of rules, cadence, accountability and habits. The name of this difference is Operational Excellence (OE). Let’s look at what it is exactly, why it works, and how you achieve it in a process-industry organization.
Operational Excellence (OE) is the integrated, systematic management of safety, environment, reliability and efficiency as a single management system.
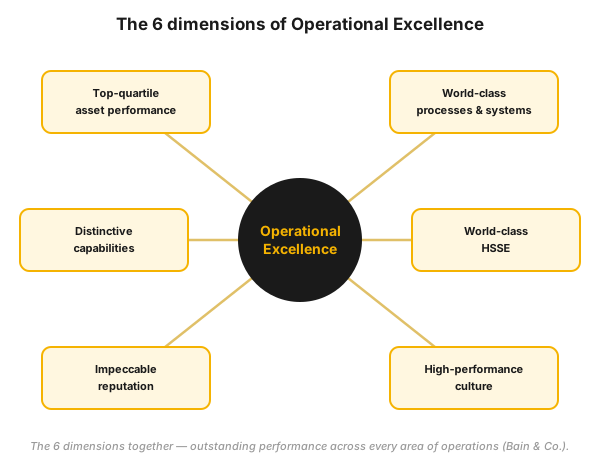 Figure 1 — the six dimensions of OE: outstanding performance is not one metric, but the simultaneous excellence of every area of operations.
OE covers process safety, personal safety and health, environmental protection, asset reliability and operating efficiency, handled in one system. It is not a single tool or program but a management system (OEMS) that codifies the best practices into rules, governance and daily leadership routine. It is also a maturity stage: the level where every employee senses the value stream reaching all the way to the customer, and fixes the fault before the failure or value loss occurs. In Aristotle’s words: “excellence is not an act, but a habit.”
Who is this for?
Section titled “Who is this for?”This article is for those responsible for operations as a whole or for a slice of them, who want to see how the picture fits together: plant manager · shift supervisor · process engineer · production manager · maintenance and reliability engineer · HSE and process-safety specialist · site and plant manager · Lean/CI and OE program lead · operator and foreman.
Learning objectives
Section titled “Learning objectives”After reading this article you will be able to:
- distinguish OE from the individual tools (Lean, Six Sigma, TPM, ISO systems), and say in what way it is broader than they are;
- list the six dimensions of OE and the four simultaneously required conditions of the OEMS;
- assess where your own organization stands on the practices × results matrix, and which axis to intervene on;
- explain what top-quartile performance delivers, and why the discipline of transient operating states has a disproportionately high return;
- recognize the limits of OE, that is, when the OEMS is NOT the right answer to a problem.
In brief
Section titled “In brief”- OE is outstanding performance across every area of operations: top-quartile asset performance, world-class processes and systems, distinctive capabilities, world-class HSSE, an impeccable reputation and a high-performance culture — all together.
- OE is carried by a management system (OEMS) whose four conditions must hold at once: content (best practices), deployment (governance), compliance (enforcement) and performance (results + continuous improvement).
- The major industry models follow the same logic, with different element counts but the same backbone: ExxonMobil OIMS, BP OMS, Chevron OEMS, DuPont OE.
- OE is also a maturity stage: the level where everyone sees the value stream reaching the customer, and fixes the fault before the failure. The path there is described by the five LEAN steps, supported by TPM, ODR and the Theory of Constraints (TOC).
- OE is not a project but the way the organization operates: a multi-year journey (design → deploy → embed → continuous improvement) kept alive by leadership commitment, over-communication and self-assessment “with teeth”.
- The stakes are measurable: top-quartile plants operate with a multiple safety advantage, higher availability, lower maintenance and operating cost, and lower energy use.
- OE is the umbrella concept over OGSM (strategy deployment) and MOS (the operating cadence); its daily executing layer is the shift log (OPEREX).
Why it matters (the stakes)
Section titled “Why it matters (the stakes)”OE is not a “nice organizational goal”: there is a measurable difference, known from industry benchmarks, between the industry average and the best quarter. In the same industry, with a comparable asset base, the top-quartile plant is not only safer but also cheaper and more productive.
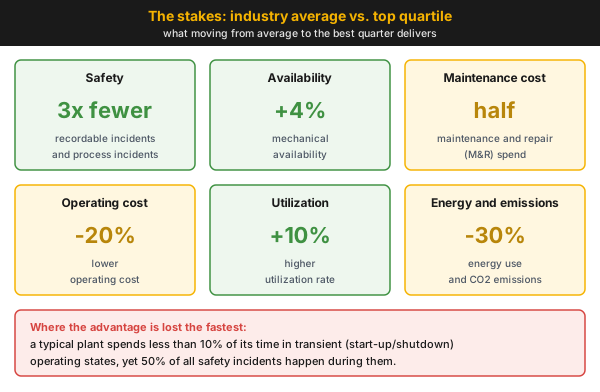 Figure 2 — the typical difference between the industry average and the top quartile across six metrics, per industry benchmark data (petroleum-refining and petrochemical benchmarks: API, Solomon, OSHA, IHS Markit and company reports). At the bottom, the few hours in which the advantage is lost the fastest.
Moving from the industry average into the top quartile typically means three times fewer recordable accidents and process incidents, roughly 4% higher mechanical availability, half the maintenance and repair spend, 20% lower operating cost, a 10% higher utilization rate, and 30% less energy use and CO₂ emissions.
If you skip this, the consequence is rarely dramatic. It is not a collapse but a slow slide: the good result hinges on the heroics of a few experienced people, the rules live on paper, incidents look like “isolated cases,” and the cost gap versus the competitor accumulates year after year.
What is Operational Excellence, and where does it come from?
Section titled “What is Operational Excellence, and where does it come from?”OE formalizes the long-known insight that competitive advantage comes not only from strategy or the product, but from operations themselves. In Tom Peters’s formulation, operations must become one of the company’s most important marketing tools, because quality, maintainability, flexibility and the length of the innovation cycle are decided by the plant. Hayes, Wheelwright and Clark add to this: what matters is not the bricks and mortar, but how well the management systems and policies run it.
OE has no single “official” definition, but the formulations of the leading industry players point in one direction:
| Source | The definition of OE, in brief |
|---|---|
| Chevron | the systematic management of process safety, personal safety and health, the environment, reliability and efficiency for world-class performance |
| DuPont | an integrated management system that raises business productivity through the application of best practices and procedures |
| Bain & Company | outstanding performance across every aspect of the enterprise (the six dimensions below) |
| Reliability framework (Uptime Elements) | the stage where every employee senses the value stream reaching the customer, and fixes the fault before the failure or value loss |
Two things are worth clarifying right away:
- OE is not a tool and not a program. Lean, Six Sigma, TPM, HAZOP or the KPI board are all tools of OE, but none of them on its own is “OE.” OE is the framework that integrates them into a single, coherent system.
- OE is not a one-off state, but a habit. Aristotle’s idea (“we become what we repeatedly do; excellence is not an act, but a habit”) is not decoration: OE is inseparable from a culture of continuous improvement, because the system is never “done.”
How does it work? The elements of the framework
Section titled “How does it work? The elements of the framework”OE is described by four layers building on one another: what excellence means (the six dimensions), what carries it (the four conditions of the OEMS), what it looks like in practice (the industry models) and where we stand now (gap diagnostics).
1) The six dimensions: what does “excellence” mean?
Section titled “1) The six dimensions: what does “excellence” mean?”The six dimensions together define OE, and none is enough on its own: an excellent safety metric with poor asset performance is no more OE than high utilization with a weak HSSE culture.
| Dimension | What it means in practice |
|---|---|
| Top-quartile asset performance | top-quarter performance on the key value drivers and on return on capital, for every asset |
| World-class processes and systems | a standardized OE system applied uniformly at group level, with the seamless integration of acquisitions |
| Distinctive capabilities | highly trained specialists and leadership, institutionalized (not person-bound) capabilities |
| World-class HSSE | best-in-class safety metrics and a superior safety culture |
| Impeccable reputation | an envied reputation in the industry and the region, with sustainable business practices |
| High-performance culture | an OE mindset in every activity, on every asset and function, with continuous-improvement behavior |
2) The OEMS: the four conditions that must all be true at once
Section titled “2) The OEMS: the four conditions that must all be true at once”The six dimensions are carried by an Operational Excellence Management System (OEMS). For the system to deliver a result, four conditions must hold at once; this is the most common source of failure, because a single missing quarter throws the whole thing off balance.
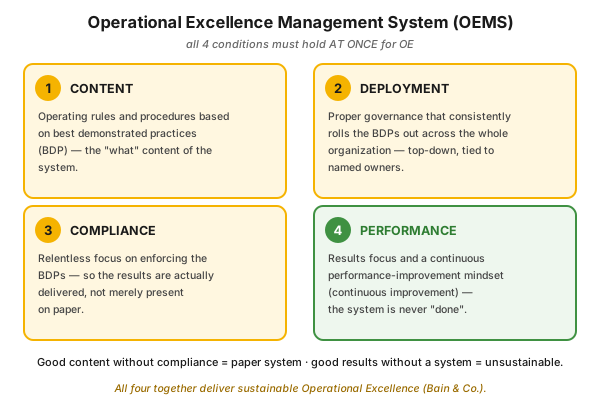 Figure 3 — the four quarters of the OEMS: content, deployment, compliance and performance; the absence of any one throws the whole off balance.
- Content: the operating rules and procedures are based on best demonstrated practices (BDP). This is the “what” content of the system.
- Deployment: proper governance that consistently extends the BDPs across the entire organization, top-down, tied to named owners.
- Compliance: a relentless focus on enforcing the best practices, so that the results are actually delivered, not merely present on paper.
- Performance: a results focus and a continuous performance-improvement mindset; the system is never “done.”
3) The industry models: OIMS, OMS, DuPont OE
Section titled “3) The industry models: OIMS, OMS, DuPont OE”The OE management systems of the leading oil and chemical companies are strikingly similar in structure. A typical OEMS covers 14 elements: strategy and leadership, organization and capabilities, performance management, change management, planning and optimization, operations and production, asset integrity and reliability, HSSE, contractor management, capital projects, operational risk management, incident and emergency management, external stakeholders, knowledge management.
| Model | Structure | What it emphasizes |
|---|---|---|
| ExxonMobil OIMS (Operations Integrity Management System) | 11 elements, 65 expectations, 200+ guidelines | it does not bring new documents but consistency and discipline in the use of existing processes |
| BP OMS (Operating Management System) | 8 elements, 48 sub-elements, 200 “essentials” | the system provides the strategic direction and the content, while the plants continuously improve the local processes |
| DuPont OE | 3 base pillars, 21 elements | an integrated “house” structure on a common organizational frame and scientific base |
The DuPont model is the most elaborated house structure, so it is worth depicting separately:
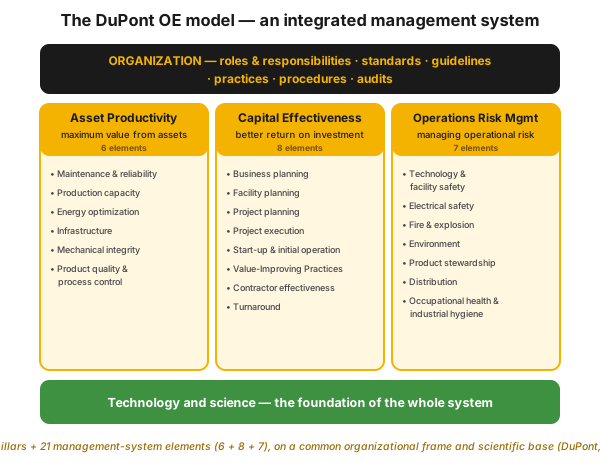 Figure 4 — the DuPont OE model: on a common organizational frame (roof) and a scientific base (foundation), three pillars hold the 21 management-system elements. Note: this is the house of the industry model, not the OPEREX house.
- Asset Productivity: extracting the maximum value from the existing asset base (maintenance and reliability, production capacity, energy optimization, infrastructure, mechanical integrity, product quality and process control). Globally, this practice gave DuPont an annual 3–5% cost-productivity gain.
- Capital Effectiveness: a better return on investments through an eight-step facility-engineering process (business planning → facility planning → project planning → execution → start-up → value-improving practices → contractor effectiveness → turnaround). By DuPont’s own experience this brought a 10–15% improvement in capital effectiveness (measured against an IPA benchmark).
- Operations Risk Management: the extension of the safety management system to process safety and behavior-based safety, with seven elements (technology and facility safety, electrical, fire and explosion, environment, product stewardship, distribution, occupational health and industrial hygiene).
4) Gap diagnostics: where does the organization stand?
Section titled “4) Gap diagnostics: where does the organization stand?”The first question in introducing OE is: where are we now? This is measured by a simple but powerful two-dimensional matrix: the combination of practices (how far the processes are deployed and codified) and results (how good the actual performance is) gives four cases.
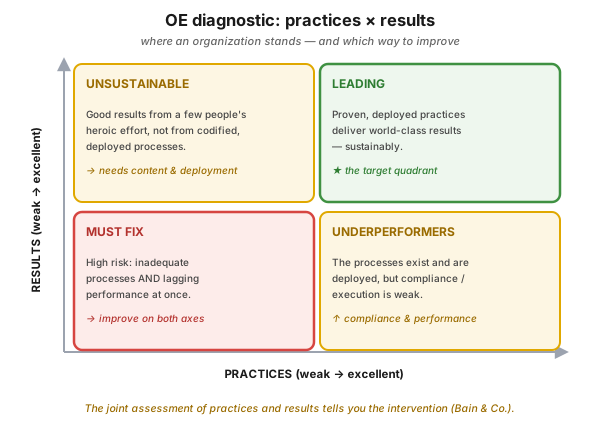 Figure 5 — the four fields of OE diagnostics: the joint assessment of practices and results tells you which direction to intervene in.
| Field | What you see | Where to intervene |
|---|---|---|
| Leading | strong practices, excellent results | this is the target quadrant: sustain, continuous improvement |
| Underperformers | the processes exist and are deployed, but execution is weak | compliance + performance |
| Unsustainable | good results from the heroic effort of a few talented people | content + deployment, otherwise fragile |
| Must fix | inadequate processes AND lagging performance | on both axes, high risk |
In a real organization the different areas (operations, integrated planning, supply chain, capital projects, HSSE) may sit in different fields. What the OE program does is precisely to move each of them toward the “leading” corner.
OE as a maturity stage: the LEAN path and its tools
Section titled “OE as a maturity stage: the LEAN path and its tools”The layers so far described the management system. But there is another reading of OE, seen from below: what maturity level must be reached on the shop floor for the system to be able to live.
In this reading, operational excellence is the stage where every employee senses the value stream reaching the customer, and fixes the faults before the failure or value loss occurs. Not a methodology and not a program, but a culture: the teamwork and problem-solving created through attention paid to customer needs, to the empowerment of the workforce, and to the optimization of the activities within the process. Almost every version of the definition contains the “fix, improve” element, and the goal is always the same: to reach or exceed the best performance level within the sector.
From this viewpoint operational excellence and asset management are two sides of the same coin: OE is the operational expression of value creation (the process, the flow, the freedom from waste), while asset management optimizes the same value across the whole life cycle of the asset.
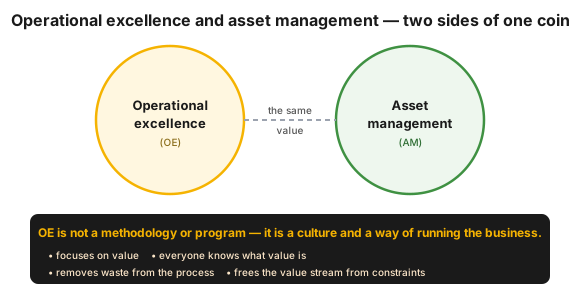 Figure 6 — operational excellence and asset management are two sides of one coin: the same value, from the operational and the life-cycle view.
The five LEAN steps as the path to excellence
Section titled “The five LEAN steps as the path to excellence”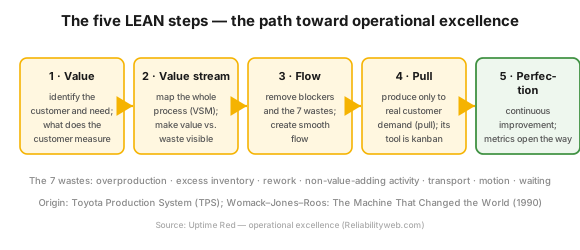 Figure 7 — the five LEAN principles as the path toward OE.
- Value (customer orientation). Identify the customer (in an operating environment, often the internal customer), and clarify: what are its concrete needs, when it needs them, what value it measures and how. Assign metrics to the needs, and ask for regular feedback on performance.
- Value stream. Examine the whole process from concept to delivery, and mark where value arises. Anything the customer does not pay for is waste. This is what the value stream map makes visible, for both the current and the future state.
- Flow. Familiarize the workforce with the value stream, review the current one, and eliminate the blocking factors. The classic seven wastes: overproduction, excess inventory, rework, non-value-adding activity, transport, unnecessary motion and waiting (see muda).
- Pull. Produce the product to the external or internal customer’s concrete need, not to a forecast. Its most common tool is the kanban (Japanese for card, signal).
- Perfection. Track the metrics and use them as the opening of the next improvement phase. The search for excellence never ends.
The supporting tools
Section titled “The supporting tools”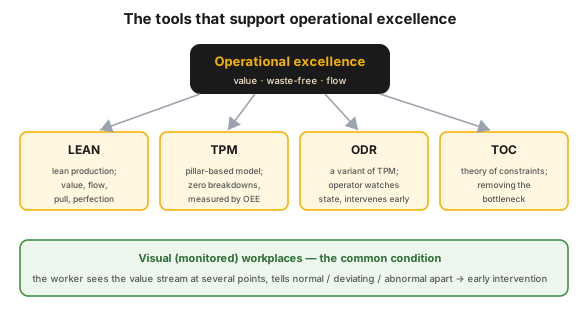 Figure 8 — the four main supporting tools and the common condition: the monitored (visual) workplaces.
- LEAN — applying the principles of lean production to filter out waste (see above).
- Total Productive Maintenance (TPM) — a pillar-based operating model (autonomous and planned maintenance, quality, focused improvement, learning, safety, planning). Not merely operator maintenance but a business culture; its goal is zero breakdowns, zero downtime and zero speed loss, and its typical metric is OEE.
- Operator-Driven Reliability (ODR) — a variant of TPM that does not require the full TPM infrastructure but assumes strong leadership support. The employee closest to the problem watches the state changes, trends and alarms, and intervenes early.
- Theory of Constraints (TOC) — removing the bottlenecks. It starts from the premise that an organization’s efficiency is controllable through three levers: procurement / inventory, throughput / production and expenses. Its steps: (1) identify the system constraint, (2) analyze the constraint’s effects, (3) subordinate the process to managing the constraint, (4) break the constraint (new work method, equipment or training), (5) repeat with the next bottleneck.
- Monitored (visual) workplaces — the common condition. On the operating floor the worker sees the value stream at several points, and can tell apart the normal, deviating and abnormal process, so early intervention happens even with minimal leadership involvement.
Of the four, the Theory of Constraints is the least known, yet its step sequence is a usable framework on its own:
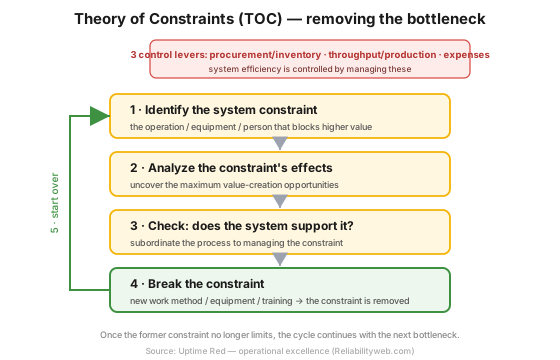 Figure 9 — the five steps of the Theory of Constraints (TOC) and the three control levers: procurement/inventory, throughput/production, expenses.
Process-industry context and safety
Section titled “Process-industry context and safety”Petroleum refining, petrochemicals and, in general, the Seveso-classified plant are the natural terrain of OE: here process safety, reliability and efficiency are not abstractions but directly the dimensions of OE. The root of the DuPont model is safety itself, and in OE world-class HSSE is not an option but the entry ticket.
Reliability as an OE pillar. By the “operations-driven reliability” principle, the owner of reliability is the plant (the shift), and maintenance is an equal partner. OE provides the framework in which this becomes an ownership mindset, closely linked to the production reliability program and the daily routine of MOS.
The digital OE layer. Modern OE is increasingly supported by a digital, model-based layer: in the “connected plant” approach, cloud-based, continuous monitoring and advisors built on physical or statistical models close the performance gaps in process reliability and yield optimization. This does not replace the OEMS but accelerates the compliance and performance quarters.
Industry independence. The culture of OE is not petroleum-refining-specific: early intervention (ODR), visual state signaling and the removal of bottlenecks apply just as much in energy, manufacturing or logistics. The process industry is the prominent example here because the stakes (the process-safety risk) are greatest.
How do you achieve OE in a process-industry organization? (roadmap)
Section titled “How do you achieve OE in a process-industry organization? (roadmap)”Introducing OE is a multi-year journey in three large phases, whose impact builds gradually but durably.
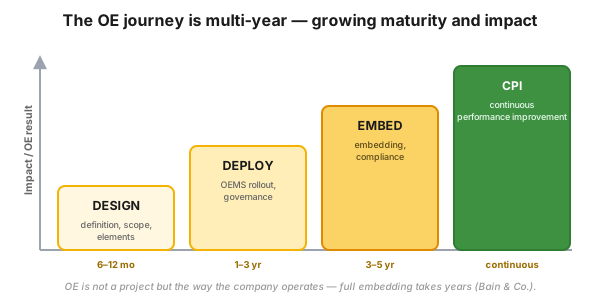 Figure 10 — the OE journey: the impact builds over years from definition to continuous performance improvement; OE is not a project but the way the organization operates.
Typical time frames: definition and design 6–12 months, deployment (deploy) 1–3 years, embedding (embed) 3–5 years, then continuous performance improvement becomes permanent.
DuPont operationalizes this as a closed improvement cycle, in which project management and communication run in parallel throughout:
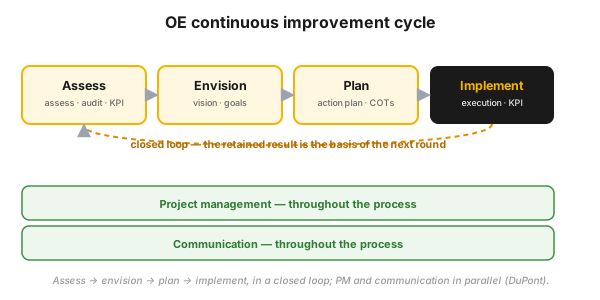 Figure 11 — the OE continuous improvement cycle: assess → envision → plan → implement, in a closed loop.
Step by step:
- Assess where you stand. Place the key areas on the practices × results matrix, separately for each area.
- Decide the scope consciously. The OEMS is not everything; write down what is in and what is not.
- Keep the requirements to a manageable number. Fewer but enforced requirements are better than many that are ignored.
- Make the requirements equal in weight. Let there be no “second-tier” element, because that is the one people will drop first.
- Tie every requirement to real operations. Make it explicit how the given element shows up in the way the organization is actually run.
- Prepare the leaders. The leaders should understand the OEMS, see it as the way of operating (not a parallel, add-on framework), and live it (“walk the talk”).
- Over-communicate. From the planning stage onward, as simply as possible, in a common language, and say what does not change too.
- Cascade accountability. Let accountability run from the top to the front line, with the OEMS requirements tied to specific positions.
- Give the self-assessment “teeth.” With consequences and incentives, a “trust but verify” culture, a peer review roughly every three years (internal review in between), and top-management attention on the high-priority areas.
- Make value visual at the shop-floor level. Monitored workplaces, so that everyone sees the normal / deviating / abnormal state, and the five LEAN steps can be walked through.
A behavior-based leadership approach. In one practical implementation pattern the emphasis was on how to break a large operating goal (for example, availability) down into measurable leadership behaviors and targets at every management level, in four phases: clarify (prioritizing the opportunity), specify (fixing the high-impact behaviors, preparing the leaders), implement (data-based feedback for results) and sustain (building the changes into the routine business processes). This is what connects the “hard” system of OE with the “soft” leadership behavior — exactly the layer that Lean leadership as coaching also describes.
Practical exercise: one page, one week
Section titled “Practical exercise: one page, one week”You don’t have to launch an OE program to begin. A shift supervisor can do this next week:
- Pick the three most important metrics of your own area (for example, unplanned downtime, one quality parameter, one safety indicator).
- For each, write in one line: what the target is, what the actual is, and how big the gap is.
- Assign to each gap one action, one owner and one deadline.
- Post the sheet where the shift can see it, and review it every day in the same three minutes.
- At the end of the week, answer two questions: which gap shrank, and which action was missed, and why?
This sheet already contains the full OE logic in miniature: content (what we measure), deployment (who is responsible), compliance (did it happen) and performance (did the gap shrink).
Measurement / audit
Section titled “Measurement / audit”OE measurement has two main directions: where we stand (maturity) and what it delivers (results).
- Maturity / gap: the practices × results matrix per asset, site or functional area; the goal is for every area to move toward the “leading” corner. The detailed self-assessment is provided by the structured expectation lists of the industry OEMSs (OIMS 65 expectations, BP 200 “essentials”).
- Result benchmarks: at companies introducing world-class manufacturing systems, product quality rose by 100–400%, manufacturing productivity by 40–70%, manufacturing capacity by 15–25%, while work-in-process inventory and product lead time both fell by 30–60%. DuPont’s own risk-management cost became seven times lower than the industry average, and its capital effectiveness improved by 10–15%.
- Operational metrics: KPIs with named owners, plus the principle of “Critical Operating Tasks” (COT) and “FELT leadership” (the direct, on-site interaction between leadership and the organization). These carry the top-level goals down to daily action.
Two worked cases on the impact:
| Starting point | Intervention | Result |
|---|---|---|
| A chemical plant was the least reliable in the group (~70% availability) and wanted to cut its variable costs | an integrated OE approach to the work processes, the applied technology and the site culture | availability rose to 90%, reliability to 91.5%, variable cost fell by $14M a year, with no safety or environmental event |
| An inorganic chemical plant wanted to improve its utilization and maintenance processes | an integrated maintenance- and reliability-improvement project (work processes, systems, cost) | maintenance and reliability spend fell by 21% (>$7M/year), unplanned downtime by 35%, and the project paid back within one year |
The lesson is not the size of the number but its direction: in both cases the work process and the culture changed first, and the financial result became a consequence of that, not the other way around.
A one-page self-assessment: draw a table with the six dimensions and the four OEMS conditions, have the team score each one on a 1–4 scale, then place the individual areas on the practices × results matrix. The scoring on its own is worth little: the important question is which row shows the largest gap between the leaders’ and the operators’ assessment. → related MOS routines.
Common mistakes
Section titled “Common mistakes”- Treating it as a program or a project. OE is “the way the organization operates,” not an extra, parallel framework. Instead: tie every OE requirement to an existing leadership routine (meeting, shift handover, audit); don’t create a separate OE process.
- Too many requirements. An oversized system is unenforceable, and precisely the important elements get lost in it. Instead: fewer but live and checked requirements.
- Content without compliance (a paper system). If the fine procedures are not matched by relentless enforcement, you become “underperformers”: the system exists, the result does not. Instead: measure compliance, not just the existence of the document.
- Results without a system (heroics). If the good numbers come from the heroics of a few people, it collapses when the first key person leaves. Instead: codify and deploy what the best people do (this is the essence of BDP).
- A lack of leadership commitment. If the leaders do not live the system, OE stays an empty slogan. Instead: make leadership behavior measurable and give it feedback.
- Under-communication. The communication need is regularly underestimated. Instead: communicate from the planning stage on, in a common language, and say what does not change too.
- “Toothless” self-assessment. Without consequences and top-management attention, the assessment becomes a formality. Instead: give it stakes and put it on the top-management agenda.
- A missing balance between standardization and the local agenda. Too many central standards kill the local ownership mindset; too few unravel the consistency. Instead: central “what,” local “how.”
- A lack of visual management. If the worker cannot see the value stream, they do not recognize the abnormal state, and early intervention is missed. Instead: a monitored workplace, where the normal / deviating / abnormal state is distinguishable at a glance.
- Introducing TPM partially, as a “quick fix.” This way the model’s return cannot be tapped. Instead: pillar by pillar, with leadership support, with a measurable OEE impact.
When NOT to use it (the limits of the method)
Section titled “When NOT to use it (the limits of the method)”OE is a broad framework, but for that very reason it is not the answer to every problem. Knowing where it ends is just as important as the framework itself:
| Situation | Why the OEMS is (primarily) not the answer | The right answer | |
|---|---|---|---|
| An acute, unfolding safety emergency | OE is a system working in months and years, not an intervention protocol | emergency procedure, safe shutdown, then incident investigation | |
| A concrete, well-defined technical fault | pulling a system-level framework over a bearing failure is overkill | targeted root-cause analysis ([[fmea.en | FMEA]], RCA), not an OE program |
| A certified safety function is needed | OE is a management system, not a certified, audited protection layer | [[lopa-sil.en | LOPA / SIL]], design per IEC 61511 |
| No leadership commitment or capacity | without governance the “deployment” quarter is missing; the system stays on paper | first build leadership commitment, a smaller, credible pilot | |
| A business-model or portfolio problem | excellent operations do not save a bad product or market | a strategic decision; OE supports this but does not replace it | |
| A certification requirement (customer or authority) | OE is not a certifiable scheme | a system per the relevant standard (ISO 9001 / 45001 etc.), embedded in OE |
Rule of thumb: OE is the right tool when the problem is recurring, system-level and affects several functions. A one-off, acute or purely technical matter needs a targeted tool.
Take it home (keys)
Section titled “Take it home (keys)”- Don’t introduce the tool, introduce the system. Lean, TPM or Six Sigma on their own are not OE; the framework is what connects them.
- Measure where you stand before you plan. The practices × results matrix tells you whether to improve the rules or the execution, and these are two completely different programs.
- Four quarters, at once. If any of content, deployment, compliance or performance is missing, the rest is in vain.
- Fewer requirements, more compliance. An unenforceable system is worse than a narrow but living one.
- Give the self-assessment teeth. Without consequences and top-management attention, every audit becomes a formality.
- The shop floor decides. If the operator cannot see the difference between the normal and the abnormal state, even the finest OEMS will not work.
- This is years, not months. Design 6–12 months, deployment 1–3 years, embedding 3–5 years; continuity is worth more than momentum.
Self-test
Section titled “Self-test”- In a plant availability is excellent, but the processes are not written down, and everything hinges on the two most experienced shift supervisors. Which field on the gap matrix is it in, and which two OEMS quarters must you work on?
- The management introduced 180 new OE requirements, all at once. Name two concrete reasons why this typically fails, and say what you would do instead.
- A typical plant spends less than 10% of its time in a transient state. Why is precisely this period one of OE’s highest-return intervention points?
Answer key
- In the “unsustainable” field: the results are good, but the codified practices are weak. You must work on the OEMS content quarter (codifying the best people’s practice into BDP) and the deployment quarter (governance, named owners). When the first key person leaves, the result collapses.
- Two typical reasons: (a) because of the unenforceable quantity the compliance quarter empties out, and precisely the important elements get lost among the many; (b) requirements launched all at once cannot be tied to existing leadership routines, so OE looks like a parallel, “add-on” framework, which the organization drops first. Instead: fewer, equal-weight, enforced requirements, each tied to an existing routine (meeting, shift handover, audit), introduced gradually.
- Because risk is not spread evenly over time: the transient state is less than 10% of the time, but half of all safety incidents happen during it. The smallest slice of time carries the greatest risk, which is why the discipline of start-up and shutdown procedures is a disproportionately high-return intervention.
How does it show up in digital practice?
Section titled “How does it show up in digital practice?”The principle of OE does not stop at the rulebooks and the meetings: the same logic is realized in software too. Instead of paper-based governance, structured data, an automatic cascade and an audit trail carry the same four quarters here.
| OE element | Digital implementation | What it delivers |
|---|---|---|
| Content (best practices) | a versioned digital procedure and standard library, searchable, available at the workplace | everyone works from the same up-to-date version |
| Deployment (governance, accountability) | a digital cascade of goals and requirements broken down to levels and positions | accountability is traceable from the top to the front line |
| Compliance | a digital checking round, checklists, completion and deviation statistics | it is measurable whether the rule actually happens, not just exists |
| Performance | a KPI dashboard in a target–actual–gap breakdown, with automatic data collection | the performance dialogue rests on facts, not memory |
| Gap diagnostics | self-assessment on a structured form, per area, compared over time | the trend of maturity is visible, not just a snapshot |
| Visual workplace | an operating-state dashboard, color-coded normal / deviating / abnormal signal | early intervention does not hinge on experience |
| Action tracking | deviation → action → owner → deadline → closure, logged | an audit trail leads from recognition to solution |
Connection to OPEREX (shift log)
Section titled “Connection to OPEREX (shift log)”OE is a top-level, umbrella framework, yet its most visible benefit is realized in the lowest, daily and shift-level layer — exactly where the shift log (OPEREX) works. The OEMS elements of “performance management,” “operations and production” and “asset integrity and reliability” mean, at the daily level, the KPI fact, the gap to target, the deviation comment and the triggered action; the shift log is the digital layer where this is recorded shift by shift, auditably. The shift log is also the digital equivalent of the “monitored workplace”: at the shift level it makes the normal / deviating / abnormal state visible, so the essence of OE — early intervention before the failure or value loss — leaves a trail. The “cadence-breaking” and abnormal events blocking the value stream are measurable from the log, and the OEE losses are trackable shift by shift. OE’s strategic breakdown is given by OGSM, its operating cadence by MOS; the shift log closes the “last meter” of both.
Terminology (HU / EN / JP)
Section titled “Terminology (HU / EN / JP)”| Hungarian | English | 日本語 (romaji) |
|---|---|---|
| Működési kiválóság | Operational Excellence (OE) | オペレーショナル・エクセレンス |
| OE menedzsmentrendszer | Operational Excellence Management System (OEMS) | — |
| Üzemeltetés (az asset team egésze, ernyő) | Operations (as an organisation) | — |
| Üzemvitel (a szűk funkció, a termelés kezelése) | Operations (as a function) | 運転 (unten) |
| Bevált (demonstrált) gyakorlat | Best Demonstrated Practice (BDP) | ベストプラクティス (best practice) |
| Eszköz-termelékenység | Asset Productivity | — |
| Tőkehatékonyság | Capital Effectiveness | — |
| Üzemi kockázatkezelés | Operations Risk Management | — |
| Üzemi integritás-irányítási rendszer | Operations Integrity Management System (OIMS) | — |
| Felső kvartilisű teljesítmény | Top Quartile Performance | — |
| Folyamatos teljesítményjavítás | Continuous Performance Improvement (CPI) | 改善 (kaizen) |
| Kritikus üzemviteli feladat | Critical Operating Task (COT) | — |
| Értékáram | Value stream | 価値の流れ |
| Húzó rendszer | Pull system | 引き (hiki) |
| Kényszerelmélet | Theory of Constraints (TOC) | — |
| Üzemeltetőtől függő megbízhatóság | Operator Driven Reliability (ODR) | — |
| Monitoros (vizuális) munkahely | Visual / monitored workplace | 見える化 (mieruka) |
| Megfelelés | Compliance | 順守 (junshu) |
| Irányítás (kormányzás) | Governance | — |
| Gembán jelenlévő vezetés | FELT leadership / Gemba | 現場 (genba) |
What is Operational Excellence (OE)?
The integrated, systematic management of process safety, personal safety, the environment, reliability and efficiency for world-class performance. Not a tool and not a program, but a management system (OEMS) and, at the same time, the maturity stage where everyone sees the value stream reaching the customer and fixes the fault before the failure.
What is the difference between Operational Excellence and Lean?
Lean (and Six Sigma, TPM, 5S) is a toolkit and philosophy for reducing waste and making value flow. OE is broader than this: an umbrella framework — a management system that integrates Lean and the other tools, from strategy (OGSM) through the daily leadership cadence (MOS) to HSSE, into a single system equipped with governance and accountability. You can “do Lean” in a project; OE, by contrast, is the way the whole organization operates.
Is OE the same as an ISO quality management system?
No, although they overlap. An ISO system (for example ISO 9001, ISO 45001) is a certifiable compliance framework; OE is broader than this and performance-driven: the goal is not the certificate but the top-quartile result. OE typically incorporates the requirements of the relevant standards, but goes beyond them in culture and continuous improvement.
How do I know where my organization stands in OE?
Place your key areas (operations, planning, HSSE, capital projects, supply chain) on the practices × results matrix. If the results are good but the codified processes are weak, “unsustainable”; if the process is good but execution is weak, “underperformers”; if both are weak, “must fix.” The goal is to move every area toward the “leading” corner.
How long does it take to introduce OE?
A multi-year journey. Typically definition and design 6–12 months, deployment (deploy) 1–3 years, embedding (embed) 3–5 years, then continuous performance improvement becomes permanent. The impact builds gradually but durably, provided the leadership stays committed throughout and the self-assessment “has teeth.”
What is the difference between OE and TPM or ODR?
TPM and ODR are the supporting tools of OE. TPM is a pillar-based operating culture, whose typical metric is OEE; ODR is its operator-centered variant that does not require the full TPM infrastructure. OE is the broader framework that integrates these together with strategy, governance and HSSE.
Do you need an external consultant?
Not necessarily. The major industry models are internal systems; a consultant can speed up the assessment and the benchmarking, but durable OE hinges on internal capability building, leadership and culture, and this cannot be outsourced.
Related concepts
Section titled “Related concepts”the OPEREX house | OGSM | MOS | policy deployment (Hoshin) | operations (the asset team) | Lean leadership as coaching | Lean change management | the vision workshop | performance management | the three lenses | the production reliability program | TPM | operator-driven reliability | value stream map | muda | kanban | OEE | profit per hour | HAZOP | LOPA / SIL | 5S | kaizen
Next step
Section titled “Next step”If you have understood this, from here it is worth going on — in this order:
- the OPEREX house — how this knowledge base is built: under the OE umbrella, the four functional legs and the two enablers. This gives the map for everything else.
- OGSM — how you break the strategy down into goals, metrics and actions, so that OE has a direction.
- MOS — the operating system: in what cadence, with whom and about what you must talk for the cascaded goals to become daily reality.
References / further reading
Section titled “References / further reading”- Robert H. Hayes, Steven C. Wheelwright, Kim B. Clark: Dynamic Manufacturing: Creating the Learning Organization. Free Press, 1988. — the primacy of management systems and policies over “bricks and mortar.”
- Tom Peters: Thriving on Chaos. Knopf, 1987. — operations as the company’s most important competitive tool.
- DuPont: Operational Excellence — An Integrated Systems Approach. 2005. — the OE model built on three pillars (asset productivity, capital effectiveness, operations risk management) and its case studies.
- ExxonMobil: Operations Integrity Management System (OIMS) Framework. — 11 elements, 65 expectations; the publicly released OIMS framework.
- BP: Operating Management System (OMS). — 8 elements, 48 sub-elements; the publicly described OMS framework.
- Chevron: Operational Excellence Management System (OEMS). — the corporate definition of the integrated management of process safety, safety, the environment, reliability and efficiency.
- Solomon Associates / API benchmarks (petroleum-refining and petrochemical performance comparison) — the industry reference for top-quartile performance.
- James P. Womack, Daniel T. Jones, Daniel Roos: The Machine That Changed the World. Rawson Associates, 1990. — the starting point of the five LEAN principles.
- Eliyahu M. Goldratt: The Goal. North River Press, 1984. — the foundational work of the Theory of Constraints.
- Raymond C. Floyd: Liquid Lean: Developing Lean Culture in the Process Industries. Productivity Press, 2010. — the process-industry adaptation of Lean and OE.
- Reliabilityweb: Uptime Elements — the reliability framework that describes operational excellence as a culture and a maturity stage.