Value stream map (VSM / MIFA)
≈ 21 min read · 4,249 words
Everyone knows their own segment, but no one knows the “big picture.” The operator knows how long distillation takes; logistics knows how long the intermediate product sits in the tank; the planner knows when the order comes — but how many days it takes in total from raw material to finished product, and how much of that is pure waiting, no one sees at a glance. The value stream map (VSM) makes exactly this visible: on a single sheet it draws the entire path from supplier to customer — together with the material and the information — and on the bottom timeline it shows that for the overwhelming part of the lead time the product is not being made, but waiting. Let’s look at what it is, how to draw it, and where it is used.
A value stream map (VSM / MIFA) depicts on a single sheet a product’s entire path from supplier to customer, together with the material and the information flow. It works with standard symbols (at Toyota it is called the material and information flow analysis, MIFA). Its goal is to make wastes and their sources visible at a glance: first we draw the current-state map, from which we derive the ideal state, then the feasibility-tuned future-state map and its associated implementation plan. The tool is one of the strategic lenses of the Lean operating system, which quantifies the lead time and separates value-adding (VA) from non-value-adding (NVA) time.
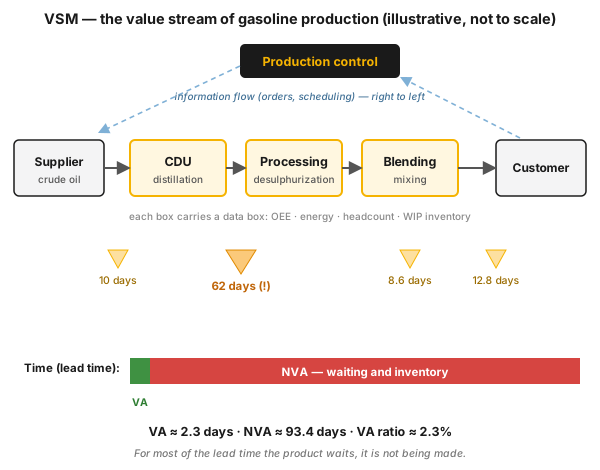
Figure 1 — the VSM depicts two flows: the material flow (solid arrow, left to right) and the information flow (dashed arrow, right to left). The triangles mark accumulated inventory (the 62-day intermediate stock is the main bottleneck), and the bottom timeline separates value-adding (VA) from non-value-adding (NVA) time — VA ratio ≈ 2.3%.
Who is this for?
Section titled “Who is this for?”This article is for those who want to see and improve the process as a whole: operator · production and plant manager · shift supervisor · process engineer · process technologist · logistics and planning specialist · Lean/CI specialist · Six Sigma black/green belt · process owner.
Learning objectives
Section titled “Learning objectives”After reading this article you will be able to:
- explain what the VSM depicts, and why the material and the information flow must be seen together;
- distinguish the current-, ideal- and future-state map, and justify why all three are needed;
- calculate the lead time and the VA ratio, and say what a value of a few percent tells you;
- walk through the 7 steps of drawing the map on the Gemba, with real data;
- decide when the VSM is not the right tool, and where to defer to the detailed VSM toolbox.
In brief
Section titled “In brief”- The VSM is a single A-sheet, comprehensive picture: the whole process from supplier to customer, together with the flow of material and information.
- The MIFA (Material and Information Flow Analysis) developed at Toyota is the origin of the method; its Lean variant is the VSM, made known by Rother and Shook’s book Learning to See.
- Always three maps: current state (what exists today + the main problems) → ideal state (how the perfect process would look) → future state (the achievable target state) + implementation plan.
- The map quantifies the lead time and separates value-adding (VA) from non-value-adding (NVA) time; this gives the VA ratio, which is typically disappointingly low.
- In process industries it works the same way: an E2E (end-to-end) view from raw-material storage to finished product, with per-machine OEE / energy / headcount / inventory data.
- Pitfall: the map becomes an end in itself (a “work of art hung on the wall”); the VSM is not a goal, but the starting point of the future state and the kaizen actions.
- The seven detailed map tools (takt, pitch, supermarket, milk run, heijunka…) are in a separate article: VSM toolbox.
Why it matters (the stakes)
Section titled “Why it matters (the stakes)”The stake of the VSM is that without it you optimize locally and miss the real bottleneck. Every segment looks “fine” on its own — meanwhile the product sits for days between two steps, and that is exactly where the biggest improvement reserve lies, the place you would never look without a map.
The process-industry gasoline example (see below) states this stake in a single number: of the nearly 96 days of lead time only ~2.3 days are value-adding — the VA ratio is ≈ 2.3%. The remaining ~93 days are waiting and inventory. If you chase machine speed (reducing the VA time), you shave off the 2.3%; if you attack the 62-day intermediate stock (the NVA), you win from the 97.7%. Without the map it is not even visible where the difference lies.
The cultural stake is just as sharp: in a Lean rollout ~95% of the loss comes from organizational barriers to change — the VSM alone solves nothing if leadership commitment and culture are not behind it.
What is it, and where does it come from?
Section titled “What is it, and where does it come from?”The value stream is the totality of all activities — value-adding and non-value-adding — needed for a product to run through from supplier to customer. The problem is that this flow is usually not visible at a glance: everyone knows their own segment, but the “big picture” is missing.
The tool’s origin is Taiichi Ohno’s machine shop at Toyota: he led a large area of responsibility, with a dissatisfied customer, and could not see the waste or the flow at a glance. A standard, visual method was needed to map the flow — thus was born the MIFA (material and information flow diagram), with which complex operations could be turned into a simple, easily surveyable picture. The method went undocumented for a long time; experienced practitioners taught it to beginners, and even its name was only recorded later. Its variant that spread in Lean is the value stream map (VSM), which Mike Rother and John Shook turned into one of the basic tools of Lean with their Shingo-Prize-winning book Learning to See.
The two names cover the same thing, with a slight difference of emphasis:
- MIFA / material and information flow diagram — the original Toyota name; the depiction and analysis of the flow of material and information. The figure presents the whole production system from suppliers to customers; its purpose is to uncover and eliminate wastes.
- VSM / value stream map — the Lean strategic tool for identifying wastes on the same basis.
What does the map depict, and what are the two flows?
Section titled “What does the map depict, and what are the two flows?”The VSM shows on a single sheet the two kinds of flow of a business process: the path of the physical material and the path of the information that controls it. Seeing the two together is the strength of the method — separately, each is misleading.
- Material flow — the path of the physical material: raw material → semi-finished → finished product, left to right (supplier → company → customer).
- Information flow — the path of forecasts, orders, production instructions; typically running backward from customer demand, through production control, to the supplier.
The map presents the whole production system, and contains:
- all suppliers and customers,
- all process steps / production lines / production cells,
- the storage locations (temporary and permanent inventories — with a triangle),
- the methods and timing of material handling (push / pull, FIFO),
- the information flow (order, scheduling, signals),
- the metrics: inventory quantities, lead / waiting times, and the key data belonging to the process.
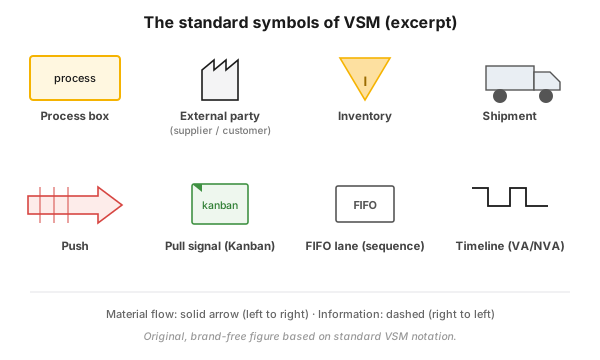
Figure 2 — the standard symbols of VSM (excerpt): process box, external party, inventory, shipment, push/pull (push/kanban), FIFO lane and timeline.
Along the bottom of the map runs a timeline: to each process step goes the processing (value-adding) time, and between the steps goes the waiting / in-inventory (non-value-adding) time. The sum of the two is the total lead time; the VA / (VA+NVA) ratio is the VA ratio, a quick indicator of the process’s “leanness.”
How to draw it step by step (in 7 steps)
Section titled “How to draw it step by step (in 7 steps)”The step sequence used in practice starts from the current state, goes through the ideal to the achievable future state, then feeds back — it is not a one-off drawing but a PDCA cycle.
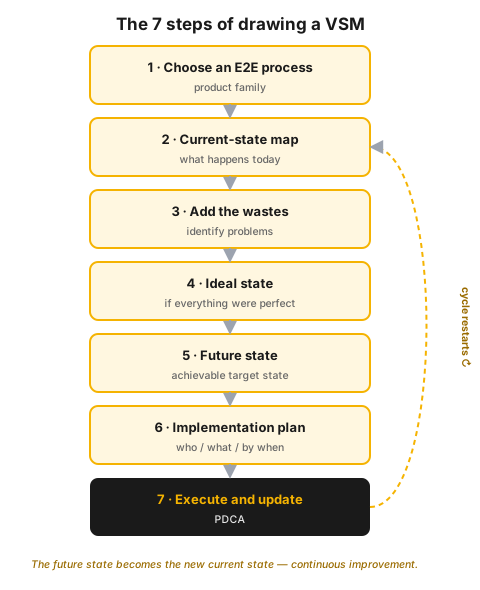
Figure 3 — the 7 steps of drawing a VSM: from the current state, through the ideal, to the achievable future state, then back (continuous improvement).
- Choose an E2E (end-to-end) process — a product/product family, from the start to the end of the process (e.g. the path of gasoline from raw-material storage to finished product).
- Map the current state — understand what happens today: the information, the material and their interactions. Go out to the Gemba (the real place), and work with the real data, not what is assumed on paper.
- Add the wastes and problems onto the map — the task of the current-state map is precisely to reveal the waste and its source.
- Draw the ideal state — think through how the process would look if “everything were perfect”; be creative, think outside the usual frame.
- Derive the future state — from the ideal map, taking feasibility into account, filter out the elements you cannot yet realize; what remains is the future-state target state.
- Make an implementation plan for reaching the future state (who, what, by when).
- Execute and maintain — the map is updated as the process develops; it is not a one-off document.
Top-level and sub-level maps (top-down)
Section titled “Top-level and sub-level maps (top-down)”In a large organization the map can be broken into levels:
- The top-level VSM is the big picture of the whole company’s operation: who the customer is, what the company gives them, and through what main processes. It sounds basic, yet it is not easy — and precisely putting it together provides an excellent common basis for discussion, because everyone sees “how the whole fits together.”
- The sub-level VSMs break down one process of the top level further. The lower we go, the easier it is to pinpoint exactly the points to improve. While documenting, the process problems become visible by themselves, and give a priority: where to intervene.
How can it be used in process-industry, continuous operation?
Section titled “How can it be used in process-industry, continuous operation?”The VSM works not only in discrete (piece) manufacturing: it applies just as well to the continuous-operation, process-industry environment. In that case the “value stream” runs from raw-material storage to finished product, and the map carries data per machine (e.g. CDU, processing, blending): OEE, energy consumption, headcount, intermediate inventory, lead time.
In process industries it is typically in the sub-level VSMs that the improvable processes surface, for example:
- maintenance / painting processes on platforms,
- handling of the chemicals used at the wells,
- recurring maintenance activities,
- procurement, equipment-rental, receivables/payables management processes,
- engineering / process-change requests (MOC-type processes).
How do you measure it? (lead time, VA ratio, audit)
Section titled “How do you measure it? (lead time, VA ratio, audit)”The VSM is itself a measuring tool: the map’s bottom timeline quantifies the flow. The key metrics and their logic:
| Metric | What it measures | Target-value logic |
|---|---|---|
| Lead time | the sum of processing times + waiting / inventory times for the whole process | the smaller, the “leaner” — in the future state a meaningful reduction is the goal |
| Value-adding time (VA) | as long as a value-adding operation from the customer’s viewpoint is happening on the product | not to be chased on its own — the least reserve is here |
| Non-value-adding time (NVA) | waiting, storage, unnecessary handling (the 7 wastes) | the greatest reserve is here — reduce this primarily |
| VA ratio = VA / (VA+NVA) | a quick indicator of the process’s “leanness” | in the current state typically very low (a few %); the future-state goal is to raise it by reducing the NVA |
| Per-process data boxes | e.g. OEE, energy consumption, headcount, intermediate inventory | they show where the bottleneck is |
Audit aspect: the map lives only if it is maintained. Updating the current state (after the future state is realized), and the fulfilment of the implementation plan’s actions (who / what / by when) are what must be reviewed from time to time — otherwise the map becomes outdated and loses credibility.
Practical example — gasoline-production VSM
Section titled “Practical example — gasoline-production VSM”The concrete process-industry example: the value stream of gasoline production from raw-material storage to finished product. The main process steps of the map:
- Raw-material storage (crude storage)
- CDU (atmospheric distillation)
- Processing (re-distillation, desulphurization, catalytic reforming / CCR, with intermediate inventory)
- Blending (mixing)
- Finished product (finished goods)
Each process step has a data box: OEE / energy consumption / headcount / intermediate inventory. And the timeline shows where the time goes:
| Segment | Time (days) |
|---|---|
| Raw-material storage | 10 |
| (processing) | 0.2 |
| Intermediate inventory | 62 |
| (processing) | 1.6 |
| (processing) | 0.5 |
| Toward semi-finished / blending | 8.6 |
| Finished product | 12.8 |
The lesson is most striking at the bottom of the map: the value-adding time ≈ 2.3 days (VA), the non-value-adding time ≈ 93.4 days (NVA) — that is a ≈ 2.3% VA ratio. (The numbers come from an illustrative process-industry example.) The 62-day intermediate inventory immediately pinpoints where the stream “stands still” — that is where the greatest improvement potential lies. This few-percent VA ratio is the VSM’s most important message: for the overwhelming part of the lead time the product is not being made, but waiting.
Putting it into practice (roadmap: pilot → rollout)
Section titled “Putting it into practice (roadmap: pilot → rollout)”- Choose a pilot value stream. An important, well-delimited E2E process for one product family. Do not try the whole factory at once — one stream, one sheet.
- Assemble a small, mixed team (process owner, team leader, operator, and whoever actually does the work). Draw the map together, on the Gemba.
- Draw the current state with real data. Measure, do not estimate: processing times, waiting / inventory times, quantities. Calculate the total lead time and the VA ratio.
- Post the map in the work area for 1-2 weeks. Let the team look at it and write their ideas, missed points and questions directly onto the map. The dusty details surface this way.
- Draw the ideal, then the future state, and mark the kaizen “bursts” (the improvement points) on the map.
- Make an implementation plan (who / what / by when) and prioritize: go for the highest-impact problems most tied to the strategic goals first, because capacity is finite.
- Execute — with kaizen / Six Sigma / project-management tools — measure the result, then update the map: the future state becomes a new current state, and the cycle restarts (PDCA).
- Roll it out to the next value streams; build it into the top-level VSM, so that the improvements fit into the big picture.
Practical mini-scenario (how you would introduce it tomorrow). Choose a painful E2E process (e.g. a product’s path from feed to dispatch). Ask for a week of real time and inventory data, then in a 2-hour Gemba workshop draw the current state on an A3 sheet, in pencil: at the top the material flow with boxes and inventory triangles, above it the information flow, at the bottom the timeline. Calculate the lead time and the VA ratio — the number alone starts the conversation about where the stream stands still.
Common mistakes
Section titled “Common mistakes”- The map becomes an end in itself. A nicely drawn current-state map on its own creates zero value. Why it’s a problem: the drawing is not improvement, the “work of art on the wall” does not reduce the lead time. Instead: always derive the future state and the concrete kaizen actions from the current state — the VSM is a tool, not an end product.
- Drawing from the desk, with estimated data. Why it’s a problem: the process assumed on paper differs from reality, and hides the root cause. Instead: go to the Gemba (San Gen Shugi), work with real data — “you’ll never find the root cause in Excel.”
- Too large a scope. Mapping the whole factory at once is unmanageable. Why it’s a problem: the picture becomes impossible to survey, and the team gets lost in the details. Instead: one value stream = one sheet; for a large system, top-down breakdown.
- Drawing only the material flow, not the information flow. Why it’s a problem: you hide the actual scheduling and pull-system problems. Instead: always draw both flows — the strength of the VSM is seeing the two together.
- Wanting to increase the VA time instead of the NVA. Why it’s a problem: 90+% of the gain is in reducing waiting and inventory, not in speeding up processing time. Instead: attack the NVA (waiting, intermediate inventory) first.
- No prioritization. Going for every problem at once. Why it’s a problem: it fragments the finite capacity, and nothing gets finished. Instead: take first the highest-impact points most tied to the strategic goal.
- Drawn once and then forgotten. Why it’s a problem: the process develops, an unmaintained map quickly becomes outdated and loses credibility. Instead: after the future state is realized, update the current state — the cycle runs on as PDCA.
When NOT to use it (the limits of the method)
Section titled “When NOT to use it (the limits of the method)”The VSM is strong but not universal. Knowing where it is not the right tool is just as important as the method itself:
| Situation | Why (primarily) not the VSM | The right answer | ||
|---|---|---|---|---|
| Internal problem of a single machine / workstation | the VSM looks at the flow of the whole process, not the internal micromovements of one station | process- or motion analysis, [[smed.en | SMED]], standard work | |
| The root cause is unknown for a specific fault | the VSM shows where the stream stands still, but not the why | [[5-miert.en | 5-Why]] / root-cause analysis, [[jidoka.en | jidoka]] |
| Very simple, linear process with few steps | the full MIFA apparatus overshoots the goal | a simple flowchart or swimlane diagram | ||
| Strong organizational resistance, no leadership support | drawing the map is technical, but ~95% of the loss is the barrier to change | first change management and leadership commitment |
Rule of thumb: the VSM is strongest for mapping the whole of lead time and flow. For micro-optimizing a single station, an unknown root cause, or a trivially simple process it does not replace the appropriate tool — it complements it.
Key takeaways
Section titled “Key takeaways”- One stream, one sheet — the VSM shows the entire path from supplier to customer, together with the material AND the information.
- Three maps in sequence: current → ideal → future + implementation plan; the future state comes from the ideal, filtered for feasibility.
- The VA ratio is the most telling number: if it is a few %, the product waits for the overwhelming part of the time — attack the NVA, not the VA.
- Draw on the Gemba, with real data — a map estimated from the desk hides the root cause.
- The map is not the goal: the future state and the kaizen actions derived from it create the value; keep the drawing maintained (PDCA).
- In process industries the future-state steps can be realized only through MOC — the VSM is the what, the MOC/HAZOP is the how, safely.
Self-check
Section titled “Self-check”- Why is it not enough to draw only the material flow — what does it hide if you leave out the information flow?
- A current-state map’s lead time is 96 days, of which 2.3 days are value-adding. What is the VA ratio, and which time (VA or NVA) is worth reducing first, and why?
- What is the difference between the ideal and the future-state map, and how do you derive one from the other?
How does this show up in digital practice?
Section titled “How does this show up in digital practice?”The principle of the VSM does not stop at the paper map stuck on the wall: the same logic is realized in software too. Instead of the pencil and the post-it, here automatically collected time and inventory data, a live process model and deviation alerting make the flow visible — the mechanism differs, the principle is the same.
| VSM principle | Digital implementation | What it delivers |
|---|---|---|
| Material and information flow in one picture | integrated process / data model (MES, digital twin map) | the whole flow in a single view seen by everyone |
| Timeline / lead time | automatic timestamp collection per step | the lead time and the VA ratio from real data, not an estimate |
| Inventory triangles | real-time inventory and tank-level data | the accumulation is immediately visible where it arises |
| Current → future state | versioned process model, target-state plan, action tracking | the improvement is trackable, the plan is not lost |
| Maintained map | a live dashboard that updates from the real data | the map does not go stale, it always shows the current state |
Connection to OPEREX (shift log)
Section titled “Connection to OPEREX (shift log)”The strength of the VSM is the real, measured data — and that is exactly what shift-based operation provides. In the OPEREX shift log, shift by shift, the data that make the map alive can be logged and retrieved: per-machine downtime / OEE, intermediate inventory levels, and the deviations arising at the current-state map’s bottlenecks. This way the VSM does not remain a one-off drawing but is fed with continuous data, and the actions of the future state’s implementation plan (who / what / by when) can be tracked auditably in the log — so updating the map is built on fact data, not on memory.
Terminology (HU / EN / JP / DE)
Section titled “Terminology (HU / EN / JP / DE)”| Hungarian | English | Other |
|---|---|---|
| értékfolyamat-térkép (értékáramtérkép) | value stream map (VSM) | DE: Wertstrom |
| anyag- és információáramlási diagram | material and information flow diagram / analysis (MIFA) | DE: Material- und Informationsflussdiagramm |
| értékfolyam | value stream | — |
| jelenállapot térkép | current state map | — |
| ideális állapot térkép | ideal state map | — |
| jövőállapot térkép | future state map | — |
| értékteremtő idő | value-adding time (VA) | — |
| nem értékteremtő idő | non-value-adding time (NVA) | — |
| átfutási idő | lead time | — |
| ütemidő | takt time | — |
| valós hely (terepi szemle) | gemba | JP: 現場 |
What is the difference between VSM and MIFA?
Essentially the same tool. The MIFA (material and information flow diagram) is the original Toyota name; the VSM (value stream map) is its variant that spread in Lean. Both depict on a single sheet the material and information flow from supplier to customer, to uncover wastes.
What are the three state maps, and why are all three needed?
The current state shows what exists today and reveals the waste; the ideal state shows how it would work perfectly; and the future state is the target state filtered for feasibility. Removing the unfeasible elements from the ideal gives the future state — this provides the realistic improvement direction and the implementation plan.
What does the VA ratio mean, and what is its typical value?
The VA ratio = value-adding time / total lead time. In the current state it is typically very low — in an illustrative process-industry example about 2.3% (2.3 value-adding days out of the total, nearly 96-day lead time). This is the map’s most telling number: for the overwhelming part of the time the product waits, it is not being made.
Can a VSM be used in a process plant, if it is not piece manufacturing?
Yes. The map applies to continuous operation just as well: the value stream runs from raw-material storage to finished product, and OEE / energy / headcount / inventory data can be assigned to the process steps (CDU, processing, blending).
Where do I start introducing the VSM?
With an important, well-delimited E2E process (pilot), a small mixed team, on the Gemba, with real data. Draw the current state, post it in the work area, collect the observations, then derive the future state and the implementation plan — and only after that roll it out.
Related concepts
Section titled “Related concepts”lean | 7-wastes | vsm-toolbox | kaizen | 5s | smed | oee | gemba | pdca | heijunka | kanban | jidoka
Next step
Section titled “Next step”If you have understood this, from here it is worth going on — in this order:
- VSM toolbox — the seven detailed tools for designing the future state (takt, pitch, supermarket, milk run, heijunka). Start with this: you have the method, now come the design tools.
- muda — the 7 wastes you see in the map’s NVA time; this lets you name what that waiting and inventory is.
- pdca — the cycle in which the future state becomes a new current state, and the map stays alive.
References / further reading
Section titled “References / further reading”- Mike Rother – John Shook: Learning to See: Value Stream Mapping to Add Value and Eliminate Muda. Lean Enterprise Institute, 1999. — the canonical, Shingo-Prize-winning foundational work on the VSM.
- Taiichi Ohno: Toyota Production System: Beyond Large-Scale Production. Productivity Press, 1988. — the original source of material- and information-flow analysis (MIFA).
- James P. Womack – Daniel T. Jones: Lean Thinking: Banish Waste and Create Wealth in Your Corporation. Simon & Schuster, 1996. — the value stream as one of the five Lean principles.