Bathtub curve and failure patterns
≈ 12 min read · 2,362 words
A pair of high heels “fails” — that is, hurts — most the first time you put them on; a cheap toy works perfectly at the beginning and then quickly starts falling apart; a circuit board, on the other hand, could last for decades but might just as well die next year. Three everyday objects, three completely different failure curves, and not one of them is what maintenance planning assumes by default. Let’s look at what the bathtub curve is, what its three phases are, and why most equipment does not follow it.
The bathtub curve is the classic model of the failure rate over time: early failures, useful life, then wear-out.
The rate is high at first but falling, then low and near-constant, and finally rises because of wear, fatigue and corrosion; the curve resembles the side view of a bathtub. An important modern insight, however, is that most complex equipment does not follow it: 77–92% of failures are random, not age-related, so periodic replacement on its own does not improve reliability — condition-directed maintenance is needed instead.
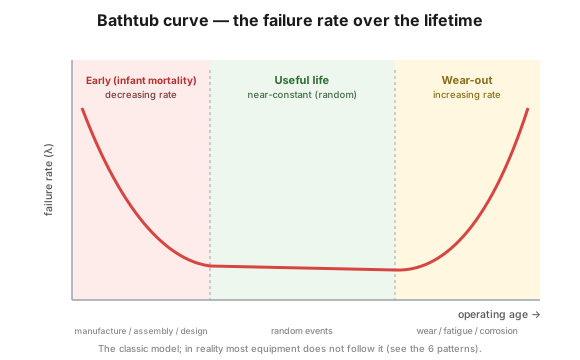 Figure 1 — the three phases of the bathtub curve.
Who is this for?
Section titled “Who is this for?”This article is for those who live with equipment failures and with the choice of maintenance tactic: plant manager · process engineer · maintenance and reliability engineer · shift supervisor · HSE specialist.
Learning objectives
Section titled “Learning objectives”After completing this module you will be able to:
- explain the relationship between the failure rate (λ) and MTBF (λ = 1/MTBF)
- name the three phases of the bathtub curve and the typical cause of failures in each
- justify why the classic bathtub curve is “the exception, not the rule” (Nowlan–Heap, 6 patterns)
- derive what a random failure means for the maintenance tactic (condition-directed, not time-based)
In brief
Section titled “In brief”- The failure rate (λ) = the number of failures per unit of time, the inverse of the mean time between failures (λ = 1/MTBF); during the useful life it is near-constant.
- Three phases: early (infant mortality) → useful life → wear-out.
- The cause of early failures is a manufacturing / assembly / design defect; of useful-life failures a random event; of wear-out failures wear / fatigue / corrosion.
- The classic bathtub curve is the exception, not the rule: 77–92% of failures are not age-related.
What is the bathtub curve, and what are its three phases?
Section titled “What is the bathtub curve, and what are its three phases?”The bathtub curve describes how the failure rate (the “hazard rate”) develops over time in three sharply distinct phases: from the falling early rate, through the near-constant useful life, to the rising wear-out.
1. Early (“infant mortality”) failures
Section titled “1. Early (“infant mortality”) failures”At the beginning of an asset’s life the rate is high but falls quickly. The causes are typically built-in defects: poor or incomplete design, a low-quality component, manufacturing, assembly and commissioning errors, and even operator human error. Many design and commissioning errors cause failure precisely in the early phase of the life; this is “infant mortality”. This phase is shortened by design quality (design for reliability) and careful commissioning.
2. Useful life
Section titled “2. Useful life”The rate is low and near-constant. Failures here are random: they are triggered not by age but by random loads, operating events and hidden faults. Because the rate is constant, this phase is the one best described by the MTBF metric (and by λ = 1/MTBF). In this phase preventive replacement does not help (the failure is not age-dependent); the right answer is the early detection of the random failure, that is, condition-directed maintenance.
3. Wear-out
Section titled “3. Wear-out”Towards the end of the life the rate rises, because wear, fatigue, corrosion and ageing accumulate. Only in this phase does an age-based (time-directed, TD) replacement or overhaul make sense, provided the asset has an identifiable wear-out age.
Why does most equipment not follow the bathtub curve? (the 6 failure patterns)
Section titled “Why does most equipment not follow the bathtub curve? (the 6 failure patterns)”Because the bathtub curve is only one of six patterns, and one of the rarer ones at that. The 1978 RCM study by Nowlan and Heap (United Airlines), confirmed by a Swedish (1973) and a US Navy (1983) investigation as well, identified six characteristic failure patterns.
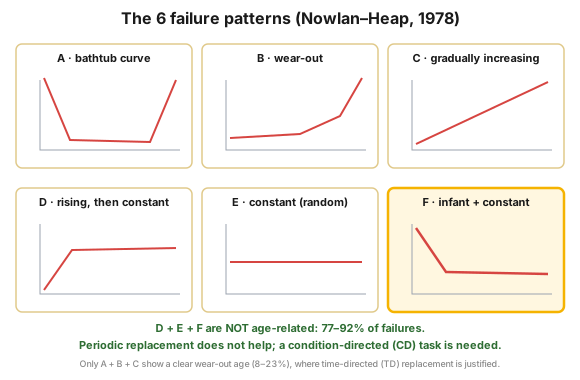 Figure 2 — the six failure patterns; the random patterns (D, E, F) dominate.
| Pattern | Character | UAL 1978 data set | Industry aggregate + example |
|---|---|---|---|
| A — bathtub curve | age-related | ~4% | ~3% — PC: fails at the beginning and at the end of life |
| B — wear-out | age-related | ~2% | ~8% — car: failures cluster above a certain age |
| C — gradually increasing | age-related | ~5% | ~8% — shoe sole: wears down, then holes appear |
| D — rising, then constant | not age-related | ~7% | ~8% — cheap toy: good at first, then quickly deteriorates |
| E — constant (random) | not age-related | ~14% | ~28% — circuit board: could last for decades, but may fail at any time |
| F — “infant mortality” + constant | not age-related | ~68% | ~46% — high heels: “hurt” most at the beginning of use |
The per-pattern shares are population-dependent (in the middle, the distribution of the 1978 aviation data set; on the right, the average reported occurrence in an industry aggregate), but the conclusion is the same in both: 77–92% of failures are random, and only 8–23% show a clear wear-out age. Wear-out occurs in just three of the curves, roughly a fifth of the degradation mechanisms.
W, I or R? In practice the six curves are simplified into three letters: W = wear-out, I = infant mortality (the intervention itself increases the probability of failure), R = random (the life of a newly installed part cannot be predicted). This letter must be established for every failure mode, because it decides the optimal tactic.
The most frequent pattern is F, and that is exactly why unnecessary periodic intervention is dangerous: disassembly and reassembly can introduce a new “infant mortality” failure into a stable system.
What does this mean for maintenance?
Section titled “What does this mean for maintenance?”It is not the age of the asset but the pattern that decides the right maintenance tactic, and the pattern is predicted by the make-up of the item:
| Character of the item | Typical pattern | Justified tactic |
|---|---|---|
| Simple, single-piece item: a direct relationship between reliability and age (metal fatigue, mechanical wear, a part designed as a consumable) | bathtub curve, wear-out, fatigue | time-directed (TD) replacement, an age limit based on operating hours or load cycles |
| Complex item: “infant mortality”, followed by a constant or slowly rising probability of failure | initial teething problems, random | condition-directed (CD) monitoring |
- Age-related (A, B, C): a time-directed (TD) replacement or overhaul before the wear-out age may make sense.
- Not age-related (D, E, F): periodic replacement does not help, and may even do harm; the right answer is condition-directed (CD) monitoring, which catches the incipient failure within the P–F interval.
- Early failures: the solution is better design and commissioning (design for reliability), not more frequent replacement.
The order of the decision matters too: in a typical framework the condition-directed task is evaluated first, because it involves a smaller intervention, is cheaper and faster, and the repair can still be planned before the failure. In many cases it is precisely the scheduled overhaul that raises the total failure rate, by introducing a high “infant mortality” into a stable system.
Industrial and safety context
Section titled “Industrial and safety context”The curve is industry-independent: it applies to machinery and electronics alike. In a hazardous (Seveso) plant two phases matter especially: the early period after start-up (design and assembly errors surface here, which is why a careful PSSR and ramp-up supervision are needed), and the wear-out phase (because of corrosion and fatigue, this is where risk-based inspection (RBI) and mechanical integrity come in for pressure-retaining systems). The “everything wears out” misconception is dangerous: in safety systems the failure is typically random and hidden, so the answer is not replacement but a failure-finding (FF) test.
Common misconceptions
Section titled “Common misconceptions”The myths around the bathtub curve are not harmless: they lead directly to bad maintenance decisions.
- “Wear-out is the most common failure mode” — a myth. The day after preventive maintenance the probability of failure is the same as it was the day before: the value added is zero or negative, because we have introduced a new risk. A preventive task is the right answer only for known wear-out type failures.
- Taking the curve literally — the bathtub curve is a model; for a specific asset one of the 6 patterns (or a mixture of them) is true.
- Confusing the useful life with the warranty period — the phases are about the failure rate, not about the guarantee.
- Assuming a constant λ for the whole life — λ is near-constant only during the useful life.
When NOT to use it (the limits of the method)
Section titled “When NOT to use it (the limits of the method)”The bathtub curve is a model, not a rule; in four situations it misleads you if you base the maintenance plan on it:
- Do not plan a time-directed (TD) replacement without a proven wear-out age. For a failure mode that is not age-related, the value added by preventive work is zero or negative, because it introduces a new “infant mortality” risk.
- Condition-directed (CD) monitoring is not universal either: its applicability is limited by the length of the P–F interval. If the failure process is too fast, there is nothing to catch.
- For a hidden failure neither is enough. If the loss of function is not evident to the operator (typically for a standby safety function), a failure-finding (FF) task is needed: this is what brings the risk of the multiple failure down to an acceptable level.
- Do not generalize from a single data set. The percentage distributions refer to specific asset populations; for your own plant, plot the pattern of your own failure history.
Take it home (keys)
Section titled “Take it home (keys)”- Ask, for every failure mode: W, I or R? The letter decides the tactic, not the age or the price of the asset.
- The “everything wears out” assumption is the most expensive mistake: 77–92% of failures are not age-related, and there periodic replacement burns money.
- Evaluate the condition-directed task first, and switch to time-directed replacement only at a proven wear-out age.
- Every disassembly is an “infant mortality” risk: before an intervention, ask what you gain by it and what you bring in with it.
- For a hidden function, test rather than replace: the failure-finding task is what makes the silent failure visible.
- Plot your own patterns from the work-order history before you cite the percentages of someone else’s data set.
Connection to OPEREX (shift log)
Section titled “Connection to OPEREX (shift log)”The phases of the curve can be recognized from shift log data. The “infant mortality” failures clustering in the first weeks after start-up become immediately visible from the events recorded in OPEREX; the random events during the useful life give a rare, scattered pattern; the approach of wear-out is signalled by rising frequency and deteriorating condition trends. This way the shift log helps decide which phase a piece of equipment is in, and helps adjust the maintenance tactic in time: first condition-directed monitoring, then time-directed replacement, and finally refurbishment or replacement.
Terminology (HU / EN)
Section titled “Terminology (HU / EN)”| Hungarian | English (canonical) | Note |
|---|---|---|
| Fürdőkád-görbe | Bathtub curve | the 3 phases of the failure rate |
| Meghibásodási ráta | Failure rate / hazard rate (λ) | λ = 1/MTBF |
| Korai (csecsemőkori) hibák | Infant mortality / early failures | falling rate |
| Hasznos élettartam | Useful life | near-constant rate |
| Elhasználódás | Wear-out | rising rate |
| Meghibásodások közti átlagidő | Mean Time Between Failures (MTBF) | the inverse of λ |
| Meghibásodási mintázatok | Failure patterns (A–F) | Nowlan & Heap, 1978 |
What is the difference between the failure of a simple and a complex item?
For a simple, single-piece item there is often a direct relationship between reliability and age (metal fatigue, mechanical wear), so time-directed replacement can work there. A complex item shows “infant mortality” failures, after which its probability of failure stays constant or rises slowly, so condition-directed monitoring is needed there.
Why does most equipment not follow the bathtub curve?
In the 1978 aviation (UAL) data set only ~4% of the patterns of the examined component population showed the classic bathtub shape. According to the concordant result of three independent studies, 77–92% of failures are not age-related; three of the six patterns (D, E, F) are random in character.
What does this mean for maintenance?
Periodic replacement does not prevent random failures; condition-directed (CD) monitoring is needed there. Time-directed (TD) replacement is justified only at a genuine wear-out age; an unnecessary overhaul may on top of that introduce an “infant mortality” failure into the system.
How are λ and MTBF related?
The failure rate (λ) is the number of failures per unit of time, and the inverse of the mean time between failures (MTBF): λ = 1/MTBF. During the useful life λ is near-constant.
What is "infant mortality"?
The initially high, then falling failure rate appearing at the beginning of an asset’s life, caused by manufacturing, assembly, commissioning or design errors. It can be shortened by good design and careful commissioning.
Self-test
Section titled “Self-test”Self-check questions
- A pump has an MTBF of 4000 operating hours. What is its failure rate (λ)?
- In which phase do manufacturing and assembly defects appear, and by what can this phase be shortened?
- Why does a time-based replacement not protect against random (age-independent) failures?
Answer key: 1) λ = 1/4000 = 2.5×10⁻⁴ /hour. · 2) In the early (“infant mortality”) phase; it can be shortened by better design and careful commissioning. · 3) Because the failure is not age-related; on top of that, the replacement may introduce a new infant-mortality risk.
Applied exercise
- Classify three of your own assets into one of the 6 failure patterns, and justify what tactic the pattern suggests.
Related concepts
Section titled “Related concepts”reliability strategy and RCM | design for reliability | preventive maintenance | criticality analysis | fmea | root cause analysis | reliability KPIs | asset condition management
References / further reading
Section titled “References / further reading”- F. S. Nowlan – H. F. Heap: Reliability-Centered Maintenance. United Airlines, 1978 (NTIS AD/A066-579) — the original source of the six patterns.
- SAE JA1011 (1999) Evaluation Criteria for RCM Processes and SAE JA1012 (2002) A Guide to the RCM Standard.
- John Moubray: Reliability-Centered Maintenance, 2nd edition, 1997 — the handbook of pattern-based maintenance planning.
- Anthony M. Smith: Reliability-Centered Maintenance. McGraw-Hill, 1993.
- ATA MSG-3 (2003) Operator/Manufacturer Scheduled Maintenance Development.
- MSZ EN ISO 14224 — reliability and maintenance data collection.