Criticality analysis
≈ 15 min read · 3,097 words
A process plant has thousands of pieces of equipment, but only a finite number of maintenance and reliability engineers. If every asset gets the same attention, in reality none of them does: the pump handling a toxic medium sits in the same work queue as a warehouse fan. Criticality analysis is what re-orders that queue.
Criticality analysis systematically ranks a plant’s assets by the business impact of their failure, so finite resources go where the risk is greatest.
The impact is measured in several dimensions: mission and customer, safety, quality, regulatory compliance, yield and cost. The criticality of an asset is essentially its risk profile: the product of the likelihood of failure and its consequence. The rating tells you where to direct the finite maintenance, reliability and investment resources first: to the critical few, which carry the overwhelming part of the total risk.
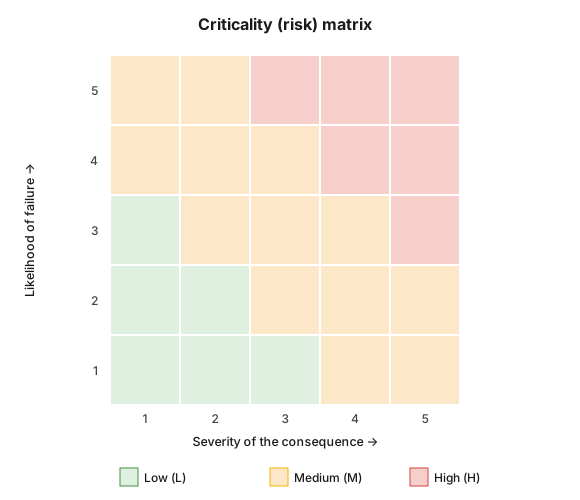 Figure 1 — the criticality (risk) matrix: likelihood and consequence together give the Low / Medium / High (L/M/H) rating. The band boundaries are illustrative; the scale and the thresholds are fixed by the organization.
Who is this for?
Section titled “Who is this for?”This article is for those who work with the rating, or with its consequences, every day: reliability engineer · maintenance planner and scheduler · maintenance manager · plant manager and shift supervisor · process engineer · HSE specialist · materials manager.
Learning objectives
Section titled “Learning objectives”After completing this module you will be able to:
- calculate asset criticality, and understand why the consequence is not only money
- apply the “critical few” principle
- place criticality analysis as the entry gate ahead of the deeper analyses (FMEA, RCA)
- build the logic of a cross-functional rating
The essence
Section titled “The essence”- Criticality = a risk profile:
(frequency of failure) × (consequence of the failure) = risk. - The consequence is not only money: beyond the production loss and the repair, the cost of safety, environment, quality and reputation counts too, that is, the total business impact of the failure.
- A large part of the total risk comes from a small percentage of the assets: it is this “critical few” that has to be identified and put first.
- Criticality analysis is the entry gate ahead of the more expensive analyses (FMEA, RCA, reliability strategy): it tells you which assets are worth spending them on.
- The rating is the work of a cross-functional team (operations, maintenance, engineering, quality, materials, HSE); the shared viewpoint filters out most sources of subjectivity.
- The output: a ranked criticality list (L/M/H or 0–100 points) that steers everything from the work order to the investment decision.
Why it matters (the stakes)
Section titled “Why it matters (the stakes)”If an organization wanted to carry out a detailed failure mode analysis on every one of its assets, that would tie up almost all of its specialized engineering capacity, and would take so long that it would delay the very benefits expected from it. The stake is therefore not the quality of the analysis but the order: criticality analysis is the cheap filter that marks out where the expensive analysis is worth taking. Whoever skips it either spreads the resource thin or chooses by instinct, and it is precisely the highest-impact asset that gets left out.
What is criticality analysis, and how does a plant rank its assets?
Section titled “What is criticality analysis, and how does a plant rank its assets?”Criticality analysis is one of the basic elements of reliability engineering for maintenance, and a cornerstone of the whole of asset management. An organization can rarely afford to treat all of its assets alike, with the greatest care, so the method ranks: it says which equipment deserves heightened attention in preventive and condition-based maintenance, in reliability initiatives and in investments.
It is important to separate it from the related FMEA: FMEA examines how an asset can fail and what the effect of that is; criticality analysis classifies and ranks the importance of the failure as it affects operations. If the FMEA also assigns a criticality rating to the failure modes, the method is called FMECA (Failure Mode, Effects and Criticality Analysis).
The method in detail
Section titled “The method in detail”The rating looks for answers to three questions: how often can the asset fail, how large is the consequence of the failure, and what is the chance that the fault will be noticed before it occurs.
The risk formula
Section titled “The risk formula”The criticality of an asset is directly proportional to the risk:
(Frequency of failure / period) × (financial consequence) = risk (/period)
The frequency is an estimated value based on the history and on the industry norms for similar situations (e.g. ISO 14224 reliability data). The consequence is the total business impact of the failure: beyond the cost of repair and lost production, the safety, environmental, quality and reputational consequence as well.
The ranking is in fact shaped by three factors: the projected failure rate of the asset, the severity of the consequence, and the probability that the fault can be detected before it occurs. This third dimension, detectability (early warning), is what links criticality to the detection term of the RPN in FMEA: of two assets with the same consequence, the more critical one is the one whose degradation is not visible in advance.
The basis of severity: ISO 14224
Section titled “The basis of severity: ISO 14224”For a shared understanding of the severity of failures, a good starting point is the four consequence categories of the ISO 14224 standard: catastrophic, critical, moderate and minor. Catastrophic is, for example, a failure leading to a fatality, a complete system failure or a production shutdown. The concrete criteria of the categories (e.g. the financial thresholds) are tailored by every organization to itself, because what is significant damage to one plant is not so to another.
The filled-in table is not an end in itself. From it the organization determines what counts as unacceptable, what has to be prevented at all costs, when a corrective action can be regarded as a justified cost, and where the level lies at which the risk is acceptable, so that the strategy of run to failure (RTF) can consciously be chosen. RTF here is not negligence but a deliberate decision made on economic grounds: the impact and cost of the failure is smaller than the cost of the preventive action. The choice of the thresholds thus remains an organizational decision in itself: the method filters out most sources of subjectivity, but does not eliminate them completely.
Qualitative or quantitative
Section titled “Qualitative or quantitative”The rating can be qualitative (Low / Medium / High, that is L/M/H) or quantitative (e.g. 0–100 points, downtime measured in hours, repair cost). The risk matrix above is the qualitative route, the weighted factor scoring below the quantitative one, to the same ranking; both need a well-defined, consistent consequence classification.
The steps
Section titled “The steps”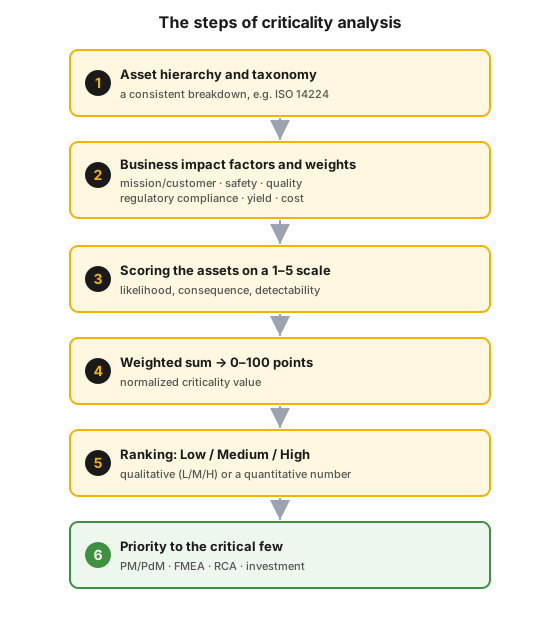 Figure 2 — the six steps of criticality analysis: from the taxonomy to giving priority to the critical few.
- Asset hierarchy and taxonomy — the asset list according to the accepted hierarchy of the CMMS, corrected on the basis of ISO 14224 where needed.
- Determining the business impact factors and weights. The summary list of six: mission/customer, safety, quality, regulatory compliance, yield and cost. There can be more scorable factors than these: the HSE impact, the isolability and recoverability of a single-point failure (redundancy), the capability of early warning, the MTBF, the lead time of the spare parts, the replacement value of the asset and the degree of its utilization.
- Scoring every asset — e.g. on a 1–5 scale per factor, where 5 is the greatest impact (by likelihood and consequence).
- Weighted sum → normalized value — converting the raw points to, for example, a 0–100 degree scale.
- Ranking (L/M/H or a number) — assets not significant from the operational viewpoint get a low (L), significant ones a medium (M), and critical ones a high (H) rating.
- Priority to the critical few — the resource focuses on the high-criticality assets: PM/PdM plan, FMEA, RCA, investment.
Worked example — asset criticality scoring
Section titled “Worked example — asset criticality scoring”The essence of the scoring on an industry-independent extract (the values are illustrative; the factors, weights and thresholds are fixed by the organization). We weight four impact factors, score each on a 1–5 scale, normalize the weighted sum to 0–100 (max. = 5 × 8 weights = 40 points = 100), then place it in a band: ≥ 75 = H, 45–74 = M, < 45 = L.
| Asset | Safety ×3 | Environment ×2 | Production loss ×2 | Repair cost ×1 | Weighted | /100 | Rating |
|---|---|---|---|---|---|---|---|
| Pump conveying a toxic medium | 5 | 5 | 4 | 3 | 36 | 90 | H |
| Main process heat exchanger | 3 | 2 | 5 | 4 | 27 | 68 | M |
| Spare (redundant) water pump | 2 | 1 | 2 | 2 | 14 | 35 | L |
Safety and environment deliberately carry the greatest weight: the pump conveying a toxic medium thus ends up at the top even if its repair is cheap. The spare pump is redundant, therefore of low criticality, and here even run to failure (RTF) is permissible. The weakest point is not necessarily the most expensive one, but the one with the greatest business impact.
Industrial and safety context
Section titled “Industrial and safety context”Criticality analysis works in any asset-intensive industry (power, manufacturing, chemicals, mining, oil processing): the logic is industry-independent, only the weights of the impact factors differ.
In a hazardous (Seveso) plant the safety and environmental impact carries the greatest weight on the consequence side: the criticality of a pressure vessel or of a line conveying a toxic medium is high not because of the repair cost but because of the potential for release / fire / injury. This is why criticality analysis is the common language of the reliability program and of safety integrity: the same rating steers the stricter risk-based inspection (RBI), the more frequent condition monitoring and the turnaround priority.
Introduction in practice
Section titled “Introduction in practice”Criticality analysis typically starts in workshop form:
- Prepare: fix the asset hierarchy and the taxonomy, collect the historical and industry data.
- Assemble the team from representatives of the key areas (operations, maintenance, engineering, quality, materials, HSE).
- Define the factors and the weights, then score the assets together.
- Calculate and rank the criticality values, then build them into the processes: the criticality code lives in the master data of the asset, at equipment level, and from there it steers the work order priority, the PM/PdM plan, the inspection plan and the investment decisions.
- Maintain it: in practice the reassessment runs by asset class and by plant, in phases (pressure vessels, pipelines and fittings, rotating machines, atmospheric tanks, instrumentation, electrical equipment), and its result is used by the asset integrity/RBI program, the RCM asset strategies and the turnaround scope.
In parallel with the criticality list it is worth running the bad actor focus as well: the item-by-item review, followed up with actions, of the assets that fail regularly and cause a disproportionate amount of loss. Criticality tells you what would be a big problem; the bad actor list tells you what actually causes one.
Common mistakes
Section titled “Common mistakes”The rating fails when routine decides instead of the method. Six mistakes occur most often.
- An FMEA on every asset is attempted. This is resource-intensive and delays the result; the critical few have to be selected first.
- The rating is made on the hunch of a single person. Without a cross-functional team the rating is disputable.
- Only the financial consequence is looked at, and the safety/environmental impact is left out, so the genuinely dangerous assets end up underestimated.
- Incomplete or uneven master data. The asset data and the usage history typically fall short of the desirable level, and on top of that the individual areas use the CMMS differently. In such a case the data has to be put in order first.
- It is treated as a one-off action, and is not reviewed when the data and the plant change.
- It does not get built into the processes. The list on its own is worthless if it does not steer the work order, the maintenance plan and the investment.
When NOT to use it? (the limits of the method)
Section titled “When NOT to use it? (the limits of the method)”Criticality analysis is a ranking filter, not a cause analysis: it tells you where to look, not what goes wrong and why.
- For a unique, non-recurring event. The scoring rests on an estimated frequency; in a scenario without precedent there is nothing to rank.
- Never in place of a certified safety function. If the question is the required level of a protection layer, that is given by LOPA and SIL analysis, not by a criticality score. Criticality sets the order of attention, not the safety integrity.
- Without an asset hierarchy and usable master data. In the absence of an accepted hierarchy and history the scoring remains a collection of opinions; the hierarchy has to be put in order first.
- When the critical few are already known. From there on the question is how the asset fails and why: FMEA, and after a failure has occurred RCA, is the next tool.
How does it appear in digital practice?
Section titled “How does it appear in digital practice?”The rating is worth something only if it does not live in a spreadsheet gathering dust in a drawer, but enforces the order in the everyday systems.
| Criticality principle | Digital implementation | What it delivers |
|---|---|---|
| The code belongs to the asset | criticality category and value in the asset master data, at equipment level | plan, work and reporting all work from the same source |
| The order is automatic | the priority of the work order derives from the criticality code | the higher-criticality work goes first, not the louder request |
| A high rating means an obligation | mandatory condition monitoring and alarm thresholds at an H rating | silent degradation becomes visible |
| The reassessment is traceable | the rating is stored versioned, with a date and an owner | it is visible when and on what basis it changed |
| The list is filterable | an asset status view filtered by criticality | the critical few are on one screen |
Connection to OPEREX (shift log)
Section titled “Connection to OPEREX (shift log)”The criticality rating of the assets gives a natural priority language to the shift handover. A digital shift log (OPEREX) can assign the events to the criticality level: the status of equipment with a high (H) rating has to be reported every shift, and a deviation observed on it goes between the outgoing and the incoming shift with higher priority and escalation. The deviations of the critical assets thus appear auditably and with priority in daily operation.
Terminology (HU / EN)
Section titled “Terminology (HU / EN)”| Hungarian | English (canonical) | Abbreviation |
|---|---|---|
| Kritikusság-analízis | Criticality Analysis | Ca |
| Hibamód- és hatáselemzés | Failure Mode and Effects Analysis | FMEA |
| Hibamód-, hatás- és kritikusságelemzés | Failure Mode, Effects and Criticality Analysis | FMECA |
| Kockázati prioritás szám | Risk Priority Number | RPN |
| Gyökérok-elemzés | Root Cause Analysis | RCA |
| Hiba-kivárás | Run To Failure | RTF |
| Megelőző karbantartás | Preventive Maintenance | PM |
| Prediktív (állapotfüggő) karbantartás | Predictive Maintenance | PdM |
| Meghibásodások közötti átlagos idő | Mean Time Between Failures | MTBF |
| Átlagos javítási idő | Mean Time To Repair | MTTR |
| Eszközgazdálkodás | Asset Management | AM |
| Számítógépes karbantartás-irányítási rendszer | Computerized Maintenance Management System | CMMS |
The JP column is omitted here: the concept is not of Japanese origin. The terminology follows the usage of the Uptime Elements and of ISO 14224.
What is the difference between criticality analysis and FMEA?
FMEA analyses the failure modes and their effects, while criticality analysis ranks: it marks out the “critical few” on which it is worth carrying out the more expensive FMEA.
How do we calculate the criticality of an asset?
Risk = (frequency of failure) × (the total business consequence of the failure), supplemented by how much chance there is of detecting the fault in advance. The rating can be qualitative (L/M/H) or quantitative (0–100 points).
Why is it not enough to look only at the financial consequence?
Because the most severe consequence of a failure is often not financial: a fatality, a serious injury or environmental pollution. In a hazardous plant, therefore, the safety and environmental impact carries the greatest weight.
Who should carry out the criticality analysis?
A cross-functional team: representatives of operations, maintenance, engineering, quality, materials management and HSE.
Which standard helps with the rating?
The consequence categories and the taxonomy of ISO 14224 are a good starting point; the concrete threshold values are tailored by every organization to itself.
Take it home (keys)
Section titled “Take it home (keys)”- The output is a ranked list, not a workshop experience: a numerical or L/M/H value per asset, which steers everything from the daily work order sequence to reliability-improvement and investment funding.
- The factors and the weights are what have to be chosen well: two is too few, ten too many, and knowing ISO 14224 helps a lot in shaping the criteria.
- Without a cross-functional team there is no valid rating: the selection of the members is the number one factor in the quality of the analysis.
- The higher-criticality work goes first: work orders are selected for execution in decreasing order of criticality.
- The rating is not static: after new data, a plant change or an investment it has to be reassessed by asset class.
- This is the cheapest entry ticket to an effective reliability improvement plan.
Self-test
Section titled “Self-test”- Asset “A”: frequency 2, consequence 5. Asset “B”: frequency 4, consequence 2. Which is the more critical?
- The consequence of two assets is the same, but the degradation of one is visible weeks in advance through vibration measurement, that of the other is not. Which is the more critical, and which factor decides?
- Why is it often enough to concentrate on a small percentage of the assets?
Answer key: 1) “A” (2×5 = 10 > 4×2 = 8). · 2) The one that has no early warning: detectability is the third factor of the ranking. · 3) Because a large part of the total risk comes from few assets (the “critical few”).
Applied exercise
- Score five assets on a 5×5 criticality matrix, and rank them by priority.
Related concepts
Section titled “Related concepts”FMEA | root cause analysis | reliability strategy and RCM | preventive maintenance | reliability KPIs | risk management | asset management and ISO 55000 | HAZOP | LOPA and SIL
Next step
Section titled “Next step”Once the criticality ranking is in place, the reliability picture builds on in this order:
- FMEA — on the critical few assets, the detailed analysis of the failure modes, effects and detectability.
- reliability strategy and RCM — the FMEA result turns into an asset strategy: condition-based, time-based, failure-finding tactics or deliberate run to failure.
- the bathtub curve — the failure patterns that tell you when time-based prevention makes sense at all.
References / further reading
Section titled “References / further reading”- ISO 14224 — Collection and exchange of reliability and maintenance data for equipment: the canonical source of the asset taxonomy and the consequence categories.
- ISO 55000 / 55001 — the standard family of the asset management system; the rating is an input to this decision-making.
- Reliabilityweb.com: Uptime Elements — the reliability framework in which criticality analysis (Ca) appears as a standalone element (Certified Reliability Leader curriculum).
- ISO 31000 — the general framework of risk management.