Option evaluation matrix — decision support in the A3
≈ 15 min read · 2,945 words
You are buying a new phone and you’re torn between three models. One is cheap but has a weak camera; another is excellent but expensive; the third is a middle ground. Instinctively you jot down a few criteria (price, battery, camera) and mentally score each one against them. That is exactly what the option evaluation matrix does in a formalized way: it arranges the alternatives and the criteria into a single table, so the decision is made not on gut feeling but visibly and comparably. Let’s look at what it is, how it is built, and where it belongs in problem solving.
An option evaluation matrix is a decision-support table in which the options stand in the columns and the evaluation criteria in the rows. At the intersections a simple scale (e.g. good / fair / poor) indicates how well the given option meets the given criterion. This makes it visually clear which solution performs best along the important criteria, and where the compromises lie; this is what underpins the Recommendation block of the A3.
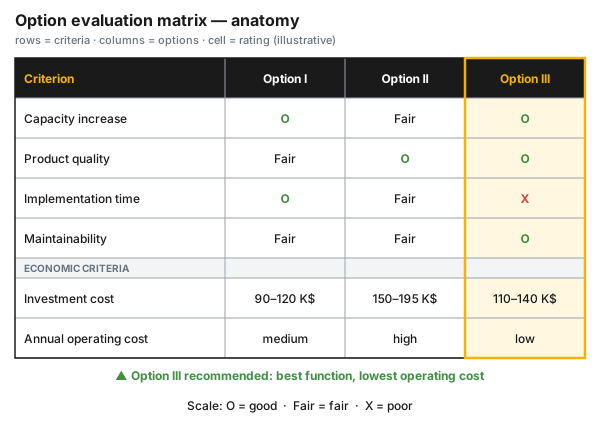 Figure 1 — the anatomy of the option evaluation matrix: the rows are the criteria (functional + economic), the columns are the options, and the cells hold the uniform rating. The highlighted column is the option that dominates along the important criteria. The values are illustrative.
Who is this for?
Section titled “Who is this for?”This article is for those who, in practice, choose among decision alternatives and have to justify the choice: production and plant manager · process and development engineer · process technologist · Lean/CI specialist · project manager · maintenance planner · investment decision-preparer.
Learning objectives
Section titled “Learning objectives”After reading this article you will be able to:
- build an option evaluation matrix (options in columns, criteria in rows, a uniform scale in the cells);
- handle functional and economic criteria together, without inventing numbers;
- decide when weighting is needed, and understand how a weight can reverse the winner;
- fit the matrix into the proposal logic of the A3 (Recommendation block);
- draw the line: when this is not the right tool (a knock-out safety criterion, unknown data, a purely financial decision).
The essence (TL;DR)
Section titled “The essence (TL;DR)”- Columns = options, rows = evaluation criteria, a uniform rating in the cell.
- A simple ordinal scale: O = good · Fair = fair · X = poor; grasped at a glance.
- Functional + economic criteria together (e.g. capability, implementation time, investment and annual operating cost).
- Extendable with weighting if some criteria matter more: then the weight may even reverse the order.
- It does not replace the decision, but it structures it and makes the arguments visible and documentable.
- Its natural home is the Recommendation block of the proposal A3: this is where it justifies why the given option is the recommended one.
Why does it matter? (the stakes)
Section titled “Why does it matter? (the stakes)”A bad decision rarely comes down to bad intentions, much more often to the fact that we did not make the arguments visible. If the choice is made purely in our heads, on the basis of the most convincing voice, three quiet failures loom: the most expensive (or the boss’s favorite) option wins, an important criterion is left out, or later no one can reconstruct why we chose exactly that.
The option evaluation matrix handles all three: the criteria are fixed in one place, in advance, every option gets the same criteria, and the finished table is an auditable trace of how the decision was made. So the stake is not only the good choice, but the defensible, retrievable choice: half a year later, when someone asks why we did not go with the other solution, the matrix is the answer.
How do we compare options with an evaluation matrix?
Section titled “How do we compare options with an evaluation matrix?”In short: we fix common criteria, score every option on the same scale, and read from the completed table which option performs best along the important criteria. The strength of the matrix is comparability: we do not praise or criticize the individual solutions separately, but look at them side by side, against the same yardstick. Alongside the functional criteria we also take up the economic ones (investment and operating cost), because the decision is almost never purely technical. Two things become clear immediately from the finished matrix: which option dominates, and where the compromises are — that is, what price we pay for which advantage.
What is the option evaluation matrix, and where does it come from?
Section titled “What is the option evaluation matrix, and where does it come from?”The option evaluation matrix is one of the oldest and simplest tools of structured decision making: a grid that compares the alternatives with the decision criteria. In engineering design the approach was systematized by Stuart Pugh (the Pugh matrix named after him, also known as Pugh Controlled Convergence), where concepts are evaluated relative to a reference solution. The other classic school of decision analysis is associated with Charles Kepner and Benjamin Tregoe, who split the criteria into knock-out (“MUST”) and desirable (“WANT”) criteria, and weighted the latter.
In Lean practice the matrix is the natural tool of the proposal A3. When an A3 does not simply solve a problem but prepares a decision (for example in favor of an investment or a technical change), then comparing the alternatives forms the backbone of the Recommendation block: the matrix shows numerically and visually why the given option is the recommended one. John Shook’s A3 methodology puts exactly this “proposal logic” at the center of decision preparation.
The method’s greatest virtue is that it makes the thinking transparent: it does not hide the compromises but lays them out on the table. This makes the decision not only better but also discussable, since everyone is looking at the same grid.
How is the matrix built? (anatomy)
Section titled “How is the matrix built? (anatomy)”The matrix’s structure comes from its three building blocks (see Figure 1):
| Element | Where | What it carries |
|---|---|---|
| Options | columns | the decision alternatives (Option I, II, III…) |
| Criteria | rows | the decision criteria — functional (capability, quality, implementation time, maintainability) and economic (investment, annual operating, construction cost) |
| Rating | cells | the uniform scale: O = good · Fair = fair · X = poor; for the economic rows often a numeric band (e.g. 90–120 K$) |
The scale is deliberately coarse and ordinal: it does not record measurements but quick, comparable value judgments. It is worth visually separating the functional criteria from the economic ones (into a distinct block), because the logic of the two differs: one is “how good,” the other “how much it costs.” The numeric costs can be given as a band (from–to) if the data is still uncertain: this is more honest than a single, falsely precise number.
How is it made? (roadmap)
Section titled “How is it made? (roadmap)”- Fix the criteria from the decision’s standpoint, before you score the options (functional + economic criteria together). This way you avoid tailoring the criteria to your favorite option after the fact.
- List the options as columns (Option I, II, III), the realistic, genuinely viable alternatives.
- Rate every intersection on a uniform scale (O / Fair / X), against the same criteria for each option.
- Add the numeric items alongside the functional criteria: estimated annual operating, investment and construction cost, where possible as a band (e.g. 90–195 K$).
- Read the matrix: which option dominates, and where the compromises are; this provides the justification for the A3’s Recommendation block.
- Introduce weighting if the criteria are of differing importance, so that a less essential criterion does not distort the overall picture.
Why (and when) should you weight?
Section titled “Why (and when) should you weight?”In short: weight when the criteria are not of equal rank, because then a simple sum can mislead. If we treat every criterion with the same weight, an option that is “moderately good” on many small criteria can beat one that is outstanding on the most important criterion. Weighting corrects this: each criterion gets a weight (relative importance), and we sum the cell scores multiplied by the weight.
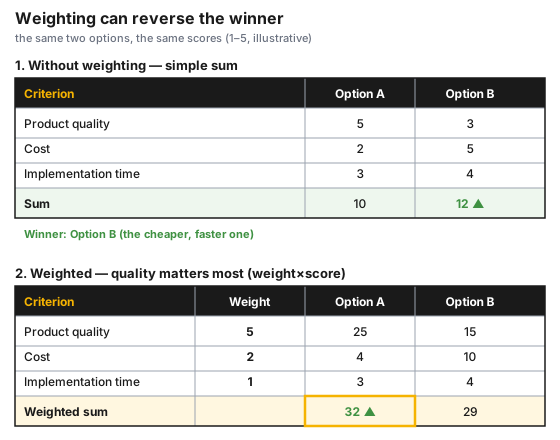 Figure 2 — the same two options, the same scores. Without weighting the cheaper, faster Option B wins; but if product quality is the most important (weight of 5), the weighted sum now brings out Option A. The scores and weights are illustrative — the scale is fixed by the organization.
The lesson: the weight not only fine-tunes but can even reverse the order. That is why the choice of weights is itself a decision, one worth making consciously and visibly, not after the scoring, tailored to the desired result.
Process-industry context + safety
Section titled “Process-industry context + safety”In the process industry the matrix typically prepares technical-economic decisions: which technological modification, which equipment variant, which maintenance or turnaround scenario is the best compromise. In such cases the criteria rows also include availability, maintainability, implementation time and downtime requirement, alongside the economic rows.
This is the essence of the Kepner–Tregoe MUST/WANT logic: the MUST (mandatory) criteria exclude, the WANT (desirable) criteria weight. Mixing the two is the matrix’s most common and most dangerous mistake.
Common mistakes
Section titled “Common mistakes”- Tailoring the criteria to the favorite option after the fact. First we decide what we want, then we tailor the criteria to it. Why it’s a problem: the matrix only looks like confirmation, when it is really confirmation bias. Instead: fix the criteria before scoring the options, preferably with a neutral participant.
- Too many criteria. Ten to fifteen criteria dilute the picture, every option performs “mixed.” Why it’s a problem: what truly differentiates disappears. Instead: 5–8 genuinely differentiating criteria; drop the non-distinguishing criterion.
- False precision. The O/Fair/X estimate is presented as a number “refined” to decimals. Why it’s a problem: it looks like a measurement when it is really a judgment — a false sense of security. Instead: keep the coarse ordinal scale, and mark that the values are estimated/illustrative.
- Only functional or only economic criteria. The technically best option is left out because of cost (or vice versa). Instead: functional and economic criteria together, in a separated block.
- Criteria treated as equal that are actually of differing importance. Why it’s a problem: an option good on an irrelevant criterion beats one excellent on an important criterion. Instead: weight (see Figure 2).
- The matrix “makes” the decision. The highest number automatically wins, without thought. Why it’s a problem: the number only structures the argument, it does not replace judgment and gemba knowledge. Instead: the matrix is the skeleton of the justification, the decision is made by the responsible person, and the matrix records why.
When NOT to use it? (limits of the method)
Section titled “When NOT to use it? (limits of the method)”The option evaluation matrix is strong, but not for every decision. Sometimes another tool is the right answer:
| Situation | Why (primarily) not the matrix | The right answer | |
|---|---|---|---|
| There is a single obvious, dominant option | unnecessary bureaucracy for a clear-cut decision | decide, and briefly document the reason | |
| The criteria or data are unknown | “garbage in, garbage out” — the grid looks precise but is empty | first data collection, [[san-gen-shugi.en | gemba]], experiment/pilot |
| A purely financial decision reducible to a common currency | the ordinal scale is coarser than the calculation | payback / NPV calculation, business case | |
| A knock-out (safety/legal) criterion decides | weighting can hide the knock-out criterion | first MUST filtering / risk analysis ([[lopa-sil.en | LOPA/SIL]]), only then a matrix on the remainder |
Rule of thumb: the matrix is strongest when there are several genuinely competing options, along several criteria of differing importance, and the decision has to be made visible and defensible. For a clear-cut, purely numeric, or knock-out-criterion decision it is not the primary tool.
Take it home (keys)
Section titled “Take it home (keys)”- Options in columns, criteria in rows, a uniform scale in the cell — that is the whole recipe.
- Functional + economic criteria always looked at together; the decision is rarely purely technical.
- Fix the criteria before scoring, so they don’t align themselves to the favorite option.
- Weight if the criteria are not of equal rank — the weight may even reverse the winner.
- Filter the knock-out criterion first (MUST), rank only the remainder (WANT) — a safety-critical decision is not settled by weighting.
- The matrix structures and documents the argument, but the decision is made by the responsible person; the finished matrix is the retrievable decision trace.
Self-test
Section titled “Self-test”- Why must the criteria be fixed before scoring the options, and what bias does this avoid?
- For two options B wins without weighting, but A once product quality is weighted — what happened, and what does this teach about weights?
- Name a situation in which the option evaluation matrix is not the right tool, and justify what takes its place.
How does it appear in digital practice?
Section titled “How does it appear in digital practice?”The principle of the matrix does not stop at paper or the spreadsheet: the same logic is realized in a digital decision-support workflow too. Instead of the manual grid, here a fixed template, a drop-down scale and automatic score calculation carry the decision: the mechanism differs, the principle is the same.
| Principle | Digital implementation | What it delivers |
|---|---|---|
| Fixed criteria | a decision template with a predefined set of criteria | prevents tailoring the criteria after the fact |
| Uniform scale | drop-down rating (good / fair / poor) | consistent evaluation, comparable across options |
| Weighting | automatic weighted score calculation | rules out human arithmetic error |
| Transparency | the decision and its justification in one place, versioned | a retrievable, auditable decision trace |
| Binding to execution | the chosen option becomes a task, owner, deadline | a closed chain from decision to implementation |
Connection to OPEREX (shift log)
Section titled “Connection to OPEREX (shift log)”A decision is worth something only if it remains retrievable later why it was made. In the OPEREX shift log the chosen option and its associated justification (the matrix output) can be logged to the action / shift log: the decision does not get lost in a separate file, but stays tied to the triggering event and the follow-up tasks. When the same question comes up later, the log shows the earlier matrix, the weights and the decision, in one place with the owner and the deadline, so the decision provides both an audit trail and a basis for learning.
Terminology (HU / EN)
Section titled “Terminology (HU / EN)”| Hungarian | English | Note |
|---|---|---|
| Opcióértékelő mátrix | decision matrix / option evaluation matrix | the structured comparison of decision alternatives |
| Pugh-mátrix | Pugh matrix / Pugh Controlled Convergence | Stuart Pugh’s concept-evaluation method, relative to a reference option |
| Súlyozott döntési mátrix | weighted decision matrix / weighted scoring | the criteria are given differing weights |
| Értékelési kritérium | evaluation criterion | functional + economic criterion |
| Kritériumsúly | criterion weight | the relative importance of the criterion |
| Kizáró / kívánatos kritérium | MUST / WANT criterion | Kepner–Tregoe: the MUST excludes, the WANT weights |
| Javaslattevő A3 | proposal A3 | the type of A3 that prepares a decision (Recommendation block) |
What is the option evaluation matrix?
A decision-support table in which the options stand in the columns and the evaluation criteria in the rows, and in the cells a simple scale (good / fair / poor) indicates how well the given option meets the given criterion. At a single glance it shows which alternative performs best along the important criteria.
What is the difference between the Pugh matrix and the weighted decision matrix?
The Pugh matrix evaluates relative to a reference option (better / same / worse), good for quick screening and concept convergence. The weighted decision matrix gives absolute scores per criterion, then sums them multiplied by the criterion weights, so it also builds in the differing importance of the criteria.
When should I use weighting?
If the criteria are not equally important. Weighting prevents a less essential criterion from distorting the overall picture, and may even reverse the order of the options (see Figure 2). If every criterion truly is of equal rank, the simple sum is enough.
Does the matrix replace the decision?
No. The matrix structures the arguments and makes them visible and documentable, but the decision is made by the responsible person. The highest score is not an automatic winner: the matrix is the skeleton of the justification, not a substitute for the decision.
How many criteria are worth taking up?
Typically 5–8 genuinely distinguishing criteria, functional and economic criteria together. Too many criteria dilute the picture; it is worth dropping the non-differentiating criterion.
Related concepts
Section titled “Related concepts”A3 report · pdca · 5 Whys · kaizen · san-gen-shugi
Next step
Section titled “Next step”If you have understood this, from here it is worth going on — in this order:
- A3 report — the matrix’s natural home: the Recommendation block of the proposal A3. Here you see where it fits in decision preparation.
- 5 Whys — the root-cause analysis worth doing before generating the options: first understand the problem, only then weigh the solutions.
- pdca — the post-decision Do-Check-Act: implementing the chosen option and measuring back the effect, so the decision turns into learning.
References / Further reading
Section titled “References / Further reading”- Stuart Pugh: Total Design: Integrated Methods for Successful Product Engineering. Addison-Wesley, 1991 — the foundational work on the Pugh matrix (concept-evaluation decision matrix).
- Charles H. Kepner & Benjamin B. Tregoe: The New Rational Manager. Princeton Research Press, 1981 — decision analysis with MUST/WANT criteria and weighting.
- John Shook: Managing to Learn: Using the A3 Management Process. Lean Enterprise Institute, 2008 — the A3 proposal logic and the Recommendation block.