The A3 report — problem solving on a single page
≈ 21 min read · 4,193 words
A familiar situation: a problem circulates in the emails, everyone thinks something different about its cause, and after three meetings there is still no decision. The A3 report was born precisely against this. It forces the entire line of thinking onto a single A3-sized sheet of paper: what the problem is, how big it really is, what its true cause is, what we are doing about it, and how we will know it worked. If this does not fit on one page, then the problem has not yet been thought through well enough. Let’s look at what it is, how it is built up, and how it structures problem solving on a single page.
The A3 report is a problem-solving and decision-making tool with PDCA logic, condensed onto an A3-sized sheet of paper, which leads all the way from the problem to the solution on a single page. The left side is understanding the problem (background, current condition with facts, root-cause analysis), the right side is the solution (target condition, countermeasures, implementation plan, follow-up). Its strength is not the form sheet, but the fact-based thinking behind it, fed by gemba observation — according to the conviction that developed at Toyota, if a problem cannot be presented clearly on one A3, then it has not yet been thought through well enough. It is at the same time a social process: the author builds consensus with the stakeholders and obtains approval before acting. The A3 is effectively the single-page, visual form of PDCA thinking.
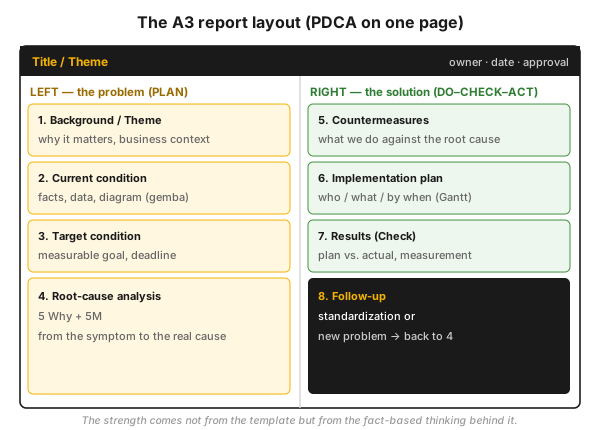 Figure 1 — the layout of the A3 report: the left side is the problem (PLAN), the right side is the solution (DO–CHECK–ACT), with the theme and the approval in the header.
Who is this for?
Section titled “Who is this for?”This article is for those who document and solve problems in practice: operator · shift and plant manager · process engineer · process technologist · maintenance technician · reliability engineer · quality and HSE specialist · Lean/CI coach.
Learning objectives
Section titled “Learning objectives”After reading this article you will be able to:
- explain why an A3 sheet is the frame, and what the size limit disciplines;
- list the seven main blocks of the A3, and say what goes on the left and what on the right;
- carry out a 5 Why + 5M root-cause analysis on a concrete failure;
- distinguish the problem-solving and the proposal A3;
- draw the boundary: when the A3 is NOT the right tool, and how it differs from PDCA.
The essence
Section titled “The essence”- The A3 is a problem-solving and decision-making report with PDCA logic, condensed onto an A3 sheet, originally from the practice of the Toyota Production System.
- The left side is understanding the problem (background, current condition, root cause), the right side is the solution (target condition, countermeasures, plan, follow-up).
- Its strength comes not from the template but from the thinking behind it: fact-based, fed by gemba observation, visually compact reasoning.
- The A3 is the documentation tool of Root Cause Problem Solving (RCPS): the end result of the 5 Why + 5M analysis on one A3.
- It is at the same time a social process: the author builds consensus with the stakeholders and obtains the appropriate level of approval before implementing.
- It has several types: problem-solving A3, proposal A3 (e.g. an investment decision) and status A3.
Why does it matter? (the stakes)
Section titled “Why does it matter? (the stakes)”Without the A3 the most common pattern is jumping to a solution: the problem appears, someone immediately orders an intervention, the symptom disappears, production continues. A few weeks later the same fault returns, because the real cause was left untouched. This is the traditional, firefighting approach: the problem must be made to disappear as fast as possible. The Lean viewpoint is the reverse: the problem is an opportunity for continuous improvement, and the root cause must be eliminated, not the symptom treated.
The stake, then, is not a single botched fix, but the full cost of the recurring problem: the repeated stoppages, the rework, the loss of capacity and the loss of trust. Taiichi Ohno frames it most sharply: “No one has more trouble than the person who claims to have no trouble.” That is, the belief in the absence of a problem is itself the greatest problem. The A3 disciplines against this: it forces you to go first to the facts and the root cause, and only then to act.
What is the A3 report, and where does it come from?
Section titled “What is the A3 report, and where does it come from?”The A3 is the structured single page that became the common language of problem solving and consensus building at Toyota. The name simply comes from the paper size: the ISO A3 (about 297×420 mm, ~11.7×16.5 in) is the largest sheet that is still surveyable at a single glance, and in the old days it fit on a fax.
The size limit is a deliberate disciplining force. At Toyota the conviction developed that if a problem or a proposal cannot be presented on a single A3, visually and factually, then it has not yet been thought through well enough. The sheet therefore forces you to the essentials.
The Toyota-style A3 is not just a document, but the imprint of a social and thinking process. The author goes through the following cycle:
- Encounters the problem — something in the current work is not ideal.
- Studies the problem — observes the work in its real context (gemba), documents and validates the current condition, quantifies the extent of the problem, and carries out root-cause analysis.
- Plans countermeasures — generates ideas toward the ideal, plans concrete countermeasures, involves the stakeholders, envisions a target condition, prepares an implementation plan, and numerically predicts the result.
- Builds consensus — with all stakeholders; for this the author may even have to investigate the problem further or rework the target condition.
- Obtains approval — the leader with the appropriate authority confirms that the problem has been studied enough, that the stakeholders are “on board,” and authorizes the change.
- Executes the plan — everyone responsible completes their task on time.
- Measures the effects — the result is measured on the date set by the follow-up plan; if it deviates from what was predicted, they find out why, and move on to the next problem.
In the Lean quality model the A3 is the fourth step, the documentation format of Root Cause Problem Solving (RCPS), under the name “Documented Problem Solving.” Its goal is to prevent the recurrence of the problem, not firefighting.
How does the A3 structure problem solving on one page?
Section titled “How does the A3 structure problem solving on one page?”The A3 cuts a single sheet in two: the left side is understanding the problem, the right side is the solution, and the left side is always completed first. The classic Toyota A3 consists of seven main blocks, with the THEME (“What are we trying to achieve?”) and the To / By / Date fields in the header.
Left side — understanding the problem (start of Plan):
- Background — the context and importance of the problem: why it is worth dealing with.
- Current Condition — a diagram of the current situation or process (not text), with the problems highlighted by “storm burst” symbols. It answers: what is not ideal, and how big the problem is, backed up by measurements.
- Cause Analysis — the list of problems and the most likely direct or root cause. The classic tool is the 5 Why: by iteratively asking backward from the symptom, we arrive at the root cause.
Right side — the solution (end of Plan + Do/Check/Act):
- Target Condition — the diagram of the proposed new process, the countermeasures with “fluffy clouds” symbols, and measurable targets (quantity, time).
- Implementation Plan — a table: What? (action) — Who? (owner) — When? (time) — Where?, plus the cost.
- Follow-Up — how and when you check the effects.
- Actual Results — typically in red ink, with the date of the check: the actual result measured against what was predicted.
The 5 Why in practice
Section titled “The 5 Why in practice”The classic tool of root-cause analysis is the 5 Why: you keep asking “why?” until, from the symptom, you reach the real cause. A machine-stoppage example shows the iterative questioning:
| # | Question | Answer |
|---|---|---|
| 1 | Why did the machine stop? | The overload fuse blew. |
| 2 | Why did the fuse blow? | There was not enough oil on the shaft. |
| 3 | Why was there not enough oil? | The oil pump does not pump enough. |
| 4 | Why does the pump not work properly? | The oil filter is clogged. |
| 5 | Why did the filter clog? | There is no preventive maintenance, no weekly cleaning. |
The root cause, therefore, is not the fuse, but the missing preventive maintenance, and the countermeasure is directed there. This can be combined with the 5M framework (Man, Material, Machine, Method, Environment), so the whys are arranged into a cause-and-effect structure: e.g. there is no SOP (Method), different fuse suppliers (Material), different operators (Man).
How is the A3 different from PDCA?
Section titled “How is the A3 different from PDCA?”In short: PDCA is the cycle, the A3 is the sheet. PDCA (Plan-Do-Check-Act) is the four-step, repeating thinking loop of continuous improvement; the A3 is the single-page, visual representation of this thinking. The two do not compete but build on each other: the A3’s left side and target condition are the Plan, the implementation is the Do, the measurement is the Check, the standardization or new problem is the Act. If the result deviates from what was predicted, the loop restarts.
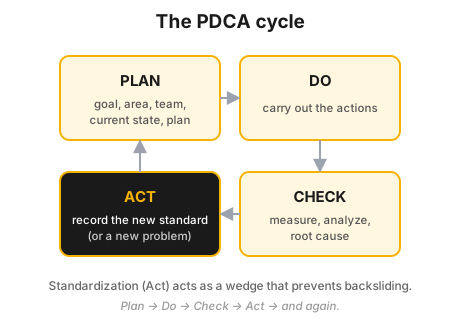 Figure 2 — the four phases of PDCA as a closed loop; the A3 carries this same logic through on a single sheet.
The practical difference: PDCA is the methodology, which can run in any format; the A3 is the concrete format and social discipline that makes PDCA into a surveyable, approvable, trackable document. For the depth of the cycle (the layers of the phases, the gateways, the connection to kaizen) see the pdca article; here the topic is the form.
Process-industry context + safety
Section titled “Process-industry context + safety”In a process-industry environment the A3 fits at several points:
- Malfunction and incident analysis: an unplanned stoppage of a technological unit (e.g. a distillation column or a reactor), a recurring pump failure or a quality loss (off-spec product) is a typical A3 topic. The current-condition diagram can be a section of the process flow diagram, and the measurements are technological parameters (OEE, availability, downtime hours, energy).
- RCPS fit: the fourth step of the Lean quality model is Root Cause Problem Solving, whose documentation format is the A3. Its goal is to prevent the recurrence of the problem and continuous improvement, not firefighting.
- Safety priority: the explicit order of the Lean operating system is “Safety – Best Quality – Lowest Cost – Shortest Lead Time.” On safety-critical equipment (pressure vessels, furnaces, rotating machinery) the root-cause analysis must never stop at the symptom, and the countermeasure must not weaken the protection layers.
- Blame-free culture: knowing who committed the mistake neither solves nor prevents the problem; the person, however, can help find the root cause. This psychological safety is the precondition of honest A3s.
Introduction in practice (roadmap: pilot → rollout)
Section titled “Introduction in practice (roadmap: pilot → rollout)”Introducing the A3 is not the handing out of a template, but the adoption of a way of thinking, in a coach-driven manner.
Phase 1 — Preparation:
- Designate a mentor/coach who has already walked through an A3 process. In the Toyota model the A3 matures in a master-apprentice relationship: the coach asks questions, does not give the solution.
- Define the competence levels according to the Level 0–4 skill matrix (the highest level: also trains others). The goal is that over time you have your own A3 coaches.
Phase 2 — Pilot (1-2 real problems): 3. Choose a painful but bounded problem (recurring, measurable, within one area), not the biggest, unsolvable matter. 4. Go out to the gemba: observe the work in its real context, document and validate the current condition, quantify the extent. 5. Fill in the left side first (background, current condition, root cause), then the right side with the coach. 6. Build consensus, obtain approval, implement, and measure according to the follow-up plan.
Phase 3 — Rollout (standardization): 7. Integrate it into the visual/performance management routine: the A3s next to the performance board show the open problem-solving efforts. 8. Tie it to the PDCA cycle and the daily/weekly meetings: every below-target (red) KPI field is a potential A3 topic. 9. Standardize: lift the solution of a proven A3 into an SOP, a skill matrix, an audit list, so it does not slide back.
Practical part: the proposal A3
Section titled “Practical part: the proposal A3”The A3 has not only a problem-solving but also a proposal/decision variant. A classic proposal A3 (e.g. the redesign of a canteen service) shows that an investment or organizational decision can also be worked through on a single sheet, with the same grammar:
- Background / current situation: fact recording (a discontinued service, the capacity of the new building, the capacity of the existing kitchen, the approved budget).
- Options: a few concrete, clearly delimited options (where the food is prepared and where it is served).
- Evaluation / comparison: an evaluation matrix (good / medium / weak per criterion) and benchmark visits to other sites (headcount, utilization, cost).
- Recommendation: a proposal supported by reasoning, with primary and secondary arguments.
- Timeline: dated milestones from the decision to the launch of the service.
The lesson: the same A3 grammar (background → options/analysis → recommendation → plan → timeline) is also suitable for fact-based decision preparation, not only for troubleshooting.
Measurement / audit
Section titled “Measurement / audit”The A3 is itself measurable, and forces measurement:
- A numerical target in the target condition: the Target Condition always contains a measurable target (quantity, time): e.g. reducing lead time, downtime, scrap rate by a concrete value.
- Prediction vs. actual: one of the most important disciplines of the A3 is that you predict the result of the implementation in advance, then in the Follow-Up you measure the actual result against the prediction. A large deviation is further learning.
- Audit aspects for an A3: (1) Is there fact data in the current condition, or only opinion? (2) Is it visual (a diagram), or a wall of text? (3) Does it go to the root cause, or stop at the symptom? (4) Is the plan concrete (What/Who/When/Where)? (5) Is there a follow-up date and an actual result? (6) Does it really fit on one page?
- Visual management logic: where the performance board is red (below target), the A3 is the carrier of the corrective action. The goal is the few, balanced KPIs (vital few), not too many indicators.
Common mistakes
Section titled “Common mistakes”- Jumping to a solution. Before writing the right side (the solution), the left side (the problem) is not properly explored. Why it’s a problem: a countermeasure planned for the wrong root cause solves nothing. Instead: fill in the whole left side first, and only then plan a solution.
- Treating the symptom instead of the root cause. The 5 Why is not carried through, they stop at the “the fuse blew” level. Why it’s a problem: the symptom returns, because the cause is untouched. Instead: carry it through to the root cause (5 Why + 5M), and direct the countermeasure there.
- A wall of text instead of a diagram. The Current/Target Condition as long prose. Why it’s a problem: it kills the surveyability, the essence of the A3. Instead: draw the process; the diagram is primary, the text only supports it.
- Opinion instead of fact data. The extent of the problem is not quantified. Why it’s a problem: the effect cannot be measured back either, there is no prediction-actual comparison. Instead: measure on the gemba, and put a number into the current condition.
- Missing consensus and approval. The A3 gets completed, but the stakeholders are not “on board.” Why it’s a problem: without the social process the implementation stalls. Instead: build consensus and obtain approval before implementation.
- No follow-up, no predicted value. The measurement and the prediction-actual comparison are left out. Why it’s a problem: there is no learning, the loop does not close. Instead: record a follow-up date and a predicted value already at planning time.
- Template fetishism. They confuse filling in the form sheet with thinking. Why it’s a problem: the A3 is the tool of thinking, not its goal. Instead: let the sheet be filled by gemba observation and reasoning, not the other way around.
- Scapegoating. The “who made the mistake?” question blocks the honest exploration of the root cause. Why it’s a problem: naming the culprit neither solves nor prevents the problem. Instead: ask for the help of the person who erred in finding the root cause, blame-free.
- Oversized scope. Too big, sprawling a problem is crammed onto one A3. Why it’s a problem: it does not fit, and it is not thought through. Instead: narrow it to a bounded, measurable problem; break the big one into parts.
When NOT to use it? (limits of the method)
Section titled “When NOT to use it? (limits of the method)”The A3 is strong but not for every situation. Knowing when a different tool is the right one is just as important as the method itself:
| Situation | Why (primarily) not the A3 | The right answer |
|---|---|---|
| An immediate, simple intervention is needed (obvious cause, quick fix) | the A3’s social process is slower than the situation is worth | a just-do-it fix, a short recording of the lesson |
| A safety-critical incident, where a certified investigation is mandatory | the A3 is not a formal, audited incident investigation | a standard-compliant incident investigation, MOC, LOPA/SIL |
| The problem is too large and sprawling for one sheet | it does not fit, and so it is not thought through | break it into sub-problems, a separate A3 for each, or a larger project frame |
| The root cause requires complex, statistical analysis | the 5 Why is not enough for multivariable causes | DMAIC / Six Sigma tools, then an A3 for the summary |
Rule of thumb: the A3 is strongest for recurring, bounded problems that can be described with facts — for decision preparation and RCPS. In safety-critical and statistically complex cases it does not replace the appropriate tool, but summarizes and communicates its result.
Take it home (keys)
Section titled “Take it home (keys)”- One sheet disciplines: if the problem does not fit on one A3, it has not yet been thought through well enough.
- The left side first: understanding the problem (facts, root cause) precedes the solution, and this protects against jumping to a solution.
- Go to the root cause: 5 Why + 5M, do not stop at the symptom (the fuse is not the real cause).
- Predict, then measure: the prediction-actual comparison is the engine of learning; without it there is no closed loop.
- The A3 is a process, not a form sheet: the gemba, the consensus and the approval make it real.
- The A3 is PDCA on one page: the form is the A3, the cycle is the PDCA, the two work together.
Self-test
Section titled “Self-test”- Why exactly A3 size for the frame, and what does the size limit discipline? What happens if the problem does not fit on one sheet?
- Carry a 5 Why through for a recurring pump failure, and say where the 5M enters — where the root cause is, and where the countermeasure is directed.
- What is the difference between the A3 and PDCA in one sentence, and how do the A3’s four main sections map onto the four phases of PDCA?
How does it appear in digital practice?
Section titled “How does it appear in digital practice?”The logic of the A3 does not end on the sheet of paper: the same structured thinking is also realized in software, in a well-designed problem-solving workflow. In place of the physical sheet, here a structured template, enforced order and automatic follow-up lead from the problem to the solution: the carrier is different, the logic is the same.
| A3 element | Digital implementation | What it delivers |
|---|---|---|
| Single-page structure | a structured problem-solving template (field-by-field blocks) | a uniform, comparable line of thinking |
| Left side first | enforced order: the solution only after the root cause is filled in | protects against jumping to a solution |
| Current condition with fact data | a data and KPI reference from the log/historian | the fact, not the opinion, goes onto the sheet |
| Implementation plan | an action tracker: owner, deadline, status | the tasks do not get lost |
| Prediction vs. actual (Follow-Up) | an automatic reminder for the follow-up date, plan-actual comparison | the learning loop closes |
| Consensus + approval | an approval workflow, a version trail | the social process is auditable |
Connection to OPEREX (shift diary)
Section titled “Connection to OPEREX (shift diary)”The shift diary (OPEREX) is the natural raw-material source of the A3s: the events, deviations, recurring incidents recorded during the shifts and the below-target KPIs are exactly the “storm bursts” from which an A3 topic is born. The recurrence read out of the log (e.g. the weekly failure of the same pump) signals that it is worth starting a root-cause analysis; and the current-condition block of the A3 can rely on the fact data obtained from the log (downtime, dates, affected units). In the reverse direction: the standards and countermeasures born from the A3 get a checkpoint in the shift diary: on the follow-up date the log shows whether the problem has returned.
Terminology (HU / EN / JP)
Section titled “Terminology (HU / EN / JP)”| Hungarian | English | Japanese / note |
|---|---|---|
| A3 riport | A3 report | A3 = ISO paper size (~297×420 mm) |
| Háttér / téma | Background / Theme | “What are we trying to do?” |
| Jelenállapot | Current Condition | from gemba observation |
| Gyökérok-elemzés | Root Cause Analysis | often 5 Why |
| 5 Miért | Five Whys | go-naze (Toyota) |
| Célállapot | Target Condition | with measurable targets |
| Ellenintézkedés | Countermeasure | not a “solution,” but a counter-move |
| Megvalósítási terv | Implementation Plan | What/Who/When/Where |
| Követés | Follow-Up | prediction vs. actual |
| Gyökérok-problémamegoldás | Root Cause Problem Solving (RCPS) | Lean quality framework |
| Tervezz-Tedd-Ellenőrizd-Avatkozz be | Plan-Do-Check-Act (PDCA) | Deming cycle |
| Helyszín | Gemba | 現場 — “the real place” |
What is the A3 report, simply?
A problem-solving and decision-making tool with PDCA logic, condensed onto an A3 sheet of paper: the left side is understanding the problem (with facts, with the root cause), the right side is the solution (target condition, plan, follow-up). Its strength is the fact-based thinking behind it, not the template.
Why exactly A3 size?
Because this is the largest sheet that is still surveyable at a single glance (and in the old days fit on a fax). The size limit is deliberate: if the problem does not fit on one A3, that signals it has not yet been thought through well enough. The size therefore forces compactness and getting to the essentials.
Is the A3 a document or a process?
Both, but the essence is the process. The sheet is the imprint of the thinking and the social process (gemba observation, consensus building, approval, measurement). Filled in as a template, without thinking, it loses its meaning.
What is the difference between the A3 and PDCA?
PDCA is the cycle, the A3 is the sheet. PDCA is the four-step thinking loop of continuous improvement; the A3 is its single-page, visual form. The left side and the target condition are the Plan, the implementation is the Do, the measurement is the Check, the standardization is the Act.
Is the A3 only good for troubleshooting?
No. Alongside the problem-solving A3 there is also a proposal A3 (e.g. an investment or organizational decision) and a status A3. The same “background → analysis → recommendation → plan → follow-up” grammar is also suitable for decision preparation.
Related concepts
Section titled “Related concepts”pdca | 5 Whys | gemba | standard work | kaizen | dmaic | poka-yoke | moc | oee | lopa-sil
Next step
Section titled “Next step”If you have understood this, from here it is worth going on — in this order:
- pdca — the cycle whose single-page form is the A3. Start with this: you understand why problem solving is iterative and experimental.
- 5 Whys — the tool of root-cause analysis that is the engine of the A3’s left side; without it you stay at the symptom.
- standard work — how you record and spread the solution born from the A3, so it does not slide back.
References / Further reading
Section titled “References / Further reading”- Durward K. Sobek II. – Art Smalley: Understanding A3 Thinking: A Critical Component of Toyota’s PDCA Management System. Productivity Press, 2008 — the canonical treatment of the A3 as a thinking and PDCA-management tool.
- John Shook: Managing to Learn: Using the A3 Management Process. Lean Enterprise Institute, 2008 — the A3 as a mentor-apprentice (coaching) process.
- Taiichi Ohno: Toyota Production System: Beyond Large-Scale Production. Productivity Press, 1988 — the source of the 5 Why and root-cause thinking.
- Jeffrey K. Liker: The Toyota Way. McGraw-Hill, 2004 — the background of Toyota’s problem-solving and continuous-improvement culture.