Safety cross — the daily colour code
≈ 11 min read · 2,227 words
On the calendar stuck to the fridge you can see at a glance how many days you have not skipped a workout. The same thing works for safety in the shift: every day gets a box, and the colour tells you what kind of day it was.
The safety cross is a visual tool: every day of the month gets one box, colour-coded green (safe shift), yellow (near-miss) or red (accident).
The team colours the boxes by hand at the end of every shift, and sums them up monthly. The cross is the visual core of the safety block on the performance board.
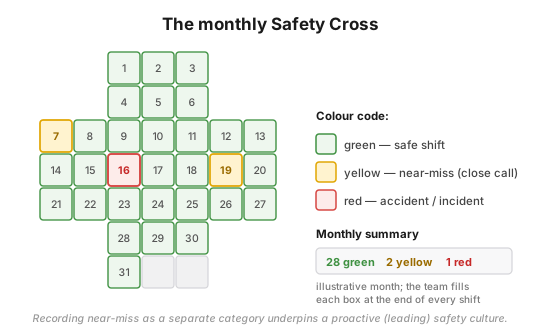
Figure 1 — the monthly safety cross: daily boxes with a three-state colour code; the near-miss (yellow) is a separate category.
Who is this for?
Section titled “Who is this for?”For those who see or assess the safety status of the shift every day: operator · shift supervisor · plant manager · HSE specialist · maintenance technician · process engineer · Lean/CI coordinator.
Learning objectives
Section titled “Learning objectives”After this article you will be able to:
- explain the meaning of the three colour codes and the rule of daily colouring;
- walk through the four steps that follow a red or yellow box, from containment to the closed action;
- say when and to which level you have to escalate;
- select the accompanying metrics, and recognize when the board turns into decoration.
In brief
Section titled “In brief”- One box = one day. The colour reflects the worst event of the day: green (safe operation), yellow (near-miss), red (accident).
- Updated every shift, coloured daily, summed up monthly, this gives the safety trend.
- Recording the near-miss as a separate category is the basis of a proactive (leading) safety culture.
- Coloured by hand, on purpose: whoever writes up the number themselves takes ownership of it.
- Accompanied by: Safety Alert, four priority focus topics, ground-rule sheets.
Why it matters (the stakes)
Section titled “Why it matters (the stakes)”Safety performance degrades quietly: in the monthly statistics everything looks smooth, while the weak signals are lost day by day. If no action is taken after a near-miss, the issue does not disappear, it grows. The stake: the yellow box should trigger an action the same day.
What is the safety cross, and how is it used in the shift?
Section titled “What is the safety cross, and how is it used in the shift?”The safety cross is a board element that displays the days of the month in a cross-shaped grid: the shift supervisor and the operators colour in the box for the day at the end of every shift, according to the worst event of the day. This way the trend of accidents and near-misses is visible day by day at machine or area level.
The cross is one of the cheapest tools of visual management (visual management): it makes the safety performance of an area readable without any software. The elements of the board are described by a uniform card:
| Question | The cross’s answer |
|---|---|
| Why? | tracking accidents and near-misses at machine or area level |
| Owner | safety officer or cell leader |
| Who updates it? | shift supervisor and operators |
| How often? | every shift; the cross daily; summary monthly |
| Where is the document? | on the board; the form in the shared document library |
How it works: what happens after a red or yellow box?
Section titled “How it works: what happens after a red or yellow box?”The colouring is only the starting point. After a yellow or red box four steps follow, always in this order: containment, communication, root cause analysis, then an owner-assigned action with a deadline.
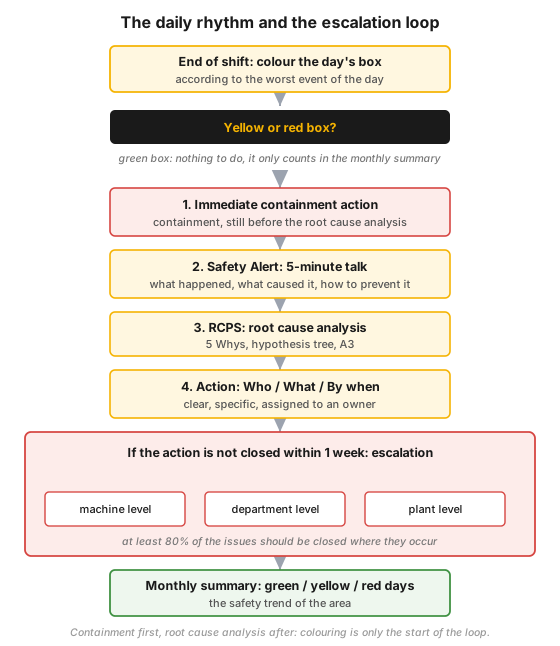
Figure 2 — the daily rhythm and the escalation loop.
- Containment first. The immediate containment action comes first, and only then the root cause analysis.
- Safety Alert: five minutes, not a poster. The safety specialist prepares a lesson-oriented summary, and the shift supervisor discusses it in five minutes at the start of the shift: what happened, what caused it, how it can be prevented. At least one occasion per week, with monthly follow-up.
- RCPS: root cause analysis (5 Whys, hypothesis tree, A3), so that the preventive action reaches the real cause (near-miss).
- Action: Who / What / By when. The action written on the board should be clear, specific and well defined; the person concerned must know about it.
| Additional element on the board | What it is for |
|---|---|
| Safety Alert | communicating the last incident, to prevent recurrence |
| four priority focus topics | the four themes of a safe workplace; the cell leader looks after them, the shift supervisor checks them every shift |
| standard forms | the basic safety, quality and behavioural rules are always available at the board |
The SQDP / SQCDP context
Section titled “The SQDP / SQCDP context”The cross belongs to the first of the areas tracked on the performance board, but the last letter of the acronym is read in two ways. In the performance-board tradition it is SQDP: Safety, Quality, Delivery, Productivity (output, material loss, energy). In the SQCDP variant used in strategy deployment, C stands for Cost and P for the people: People, the engaged employees. The order is the same in both: safety comes before quality, delivery and cost, which is why the daily performance dialogue starts with the yellow or red box (performance board).
Process-industry context and safety
Section titled “Process-industry context and safety”In a Seveso-classified process plant the cross is the visual foundation of the proactive (leading) safety indicators: serious accidents are rare, but their weak signals are frequent (near-miss, demand on a protection layer, procedural deviation; near-miss, Tier 1–4).
The cross is a lagging and a leading tool at the same time: the ratio of red and green days is a retrospective metric, while the yellow boxes are forward-looking signals, so the near-miss should not be treated on a “we got away with it” basis. On its own it is not enough: in strategy deployment, too, it is accompanied by a regular leadership safety walk and a standardized plant order (housekeeping), with its own metric.
Putting it into practice (roadmap)
Section titled “Putting it into practice (roadmap)”Introduction does not start with manufacturing the board, but with the team building it themselves and filling it in by hand.
- Build it with the team, by hand. The board should be made by those who will work with it, with manual updating: whoever writes up the number themselves takes ownership of the result.
- Choose a place near the equipment: at a safe, not too noisy point, so that the short discussion can also be held there.
- Fix the colour-code rule: what counts as a near-miss and what as an accident; decide the borderline case in favour of the near-miss.
- Build it into the daily routine: colouring is a mandatory step of shift closing, and reviewing the cross is the first item of the daily review.
- Regulate the escalation: at least 80% of the issues should be closed where they arose; if an action is not closed within one week, it should move from machine or equipment level to department level, and then to plant level.
- Sum up monthly: green, yellow and red days, near-miss ratio, closure rate.
Measurement and audit: what to track alongside the cross?
Section titled “Measurement and audit: what to track alongside the cross?”The colours of the cross give a daily status, not a metric. The measures actually tracked under the safety block:
- Number of lost-time accidents (LTI / LTA).
- Number of minor accidents (events without lost time).
- Number of dangerous occurrences.
- Number of near-miss reports: a leading complement — the more that come to the surface, the more mature the reporting culture.
- Ratio of green days, and the closure rate and lead time of the actions following a near-miss.
Common mistakes
Section titled “Common mistakes”- “Swallowing” the near-miss. If the yellow box is a source of shame, the most valuable signal disappears. Correction: blame-free reporting.
- Colouring out of routine. If every day is automatically green, the board loses its credibility. Correction: fact-based colour, according to the worst event of the day.
- No action behind the red or yellow. Visualization on its own does not improve anything. Correction: a Who / What / By when action that the person concerned knows about.
- A lagging reading only. Correction: the near-miss trend is a leading indicator.
- A computer printout instead of handwriting. Ownership is lost. Correction: the team should fill in the daily box by hand.
When NOT to use it (the limits of the method)
Section titled “When NOT to use it (the limits of the method)”The cross is cheap and powerful, but narrow in scope. In four situations it is the wrong answer:
- If it is meant as an information noticeboard. The performance board is not an information board: as merely posted data it loses its function.
- If the board itself is the goal. The real goal is a working performance management system, of which the board is a small part; without dialogue, action tracking and escalation the cross does not improve anything.
- If it were used instead of an investigation system. The cross signals, it does not investigate: it does not replace root cause analysis (near-miss).
- If a certified protective function is needed. A visual board is not a barrier: a colour code does not replace the protection layers prescribed by HAZOP.
How does this show up in digital practice?
Section titled “How does this show up in digital practice?”The daily visible status and the enforced reaction can also be realized in software: the mechanism differs, the principle is the same.
| Element of the cross | Digital implementation | What it delivers |
|---|---|---|
| daily colour code | shift-closing safety status as a mandatory field | no day can be skipped |
| yellow box | near-miss report form within the shift | the weak signal is captured at the source |
| containment, then RCPS | incident workflow that asks for a containment step before the investigation | an enforced order |
| Who / What / By when + escalation | action tracker with owner, deadline and automatic reminder | no ownerless action |
| monthly summary | automatic trend, audit trail per ISO 45001 §10.2 | audit-ready documentation |
Connection to OPEREX (shift log)
Section titled “Connection to OPEREX (shift log)”The OPEREX shift log records the shift-by-shift safety status and the near-miss / accident events, so the colouring is produced as auditable data: every entry goes into the log with a timestamp, an owner and a short description, creating the trail required by ISO 45001 §10.2. The monthly summary is generated automatically, and the Safety Alert becomes a highlighted item of the shift handover.
Take it home (keys)
Section titled “Take it home (keys)”- Colour according to the worst event of the day, by hand, at the end of every shift.
- After a yellow or red box contain first, and only then investigate.
- Discuss the Safety Alert in five minutes, do not just post it.
- Behind every coloured box write a Who / What / By when action, with a one-week escalation clock.
- Do not try to reduce the near-miss count: the weak signal that comes to the surface is a value.
Terminology (HU / EN / JP)
Section titled “Terminology (HU / EN / JP)”| Hungarian | English (canonical) | 日本語 (rōmaji) |
|---|---|---|
| biztonsági kereszt | safety cross | — |
| majdnem-baleset | near-miss | ヒヤリハット (hiyari-hatto) |
| biztonsági figyelmeztetés | safety alert | — |
| elszigetelő intézkedés | containment action | — |
| gyökérok-elemzés | root cause problem solving (RCPS) | — |
| teljesítménytábla, vizuális menedzsment | performance board, visual management | 見える化 (mieru-ka) |
What do the colours of the safety cross mean?
Green = safe operation, yellow = near-miss, red = accident. The box gets the colour of the worst event of the day, so the month’s safety performance can be seen at a glance.
How often is the safety cross updated?
Every shift; the cross is coloured daily, and the safety trend is summed up from it monthly.
What happens after a red or yellow box?
First an immediate containment action, then a Safety Alert (a five-minute talk focused on causes and prevention), then root cause analysis, and finally a Who / What / By when action. If it is not closed within one week, it has to be escalated to the next level.
Why is the cross coloured by hand if software exists?
Because filling it in by hand creates ownership: whoever writes up their own result feels responsible for it, and handwriting makes you think. The digital system replaces the audit trail and the monthly summary, not the daily routine.
Self-test
Section titled “Self-test”- Why does the worst event of the day give the colour of the box, and what happens to the board’s credibility without this?
- List the four steps after a red box. Which one comes before the root cause analysis, and why?
- An action has been open at machine level for three weeks. What does the rule say about this, and where should it have been escalated?
Related concepts
Section titled “Related concepts”performance board · near-miss · visual management · shift handover · performance dialogue · HAZOP
Next step
Section titled “Next step”- near-miss — what counts as a near-miss, and how it is investigated.
- performance board — the frame of which the cross is the safety block.
- performance dialogue — the daily meeting where the coloured box turns into an action.
References / further reading
Section titled “References / further reading”- ISO 45001:2018 §10.2 “Incident, nonconformity and corrective action”: investigation of incidents and corrective actions.
- API RP 754 — Process Safety Performance Indicators for the Refining and Petrochemical Industries: the event tier system.
- IOGP — Process safety: recommended practice on key performance indicators: Tier 1–4 indicators.
- Seveso III Directive (2012/18/EU) — recording events and near-misses in the safety management system.