FMEA — failure mode and effects
≈ 20 min read · 4,069 words
Before a long drive you walk around the car: brake discs, tyres, brake fluid. While doing it you answer three questions: what could break, how bad would it be, and would I notice in time? FMEA raises these three questions into a method, extended to a team and to a whole plant.
FMEA (failure mode and effects analysis) is a structured team method that identifies and ranks potential failures before they happen.
It works through how the elements of a product, a design or a process can fail (failure modes), with what consequence, what causes it, and how detectable the failure is before its effect appears. Every failure mode is scored on three factors: severity (S), occurrence (O) and detection (D), whose product is the risk priority number (RPN = S × O × D). Its aim is not to explain a failure after the fact but to prevent it: the risk is aligned with its source, and then severity, occurrence and undetectability all come down.
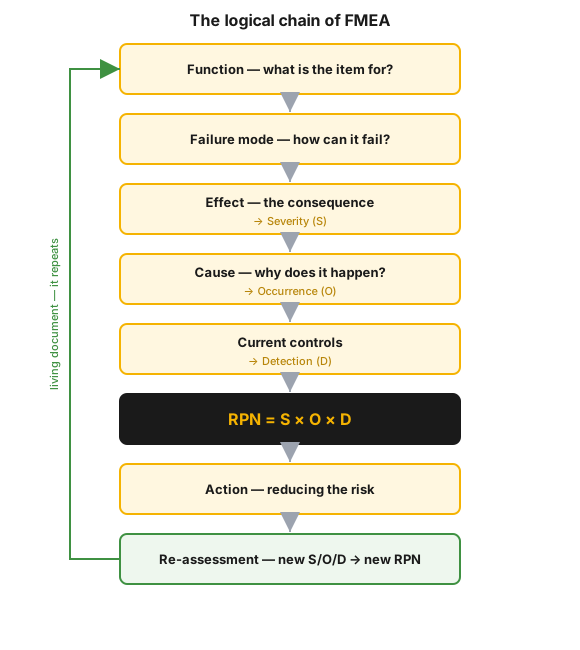 Figure 1 — the logical chain of FMEA: from function through failure mode, effect, cause and control to the RPN, the action and the re-assessment; the chain repeats in every cycle.
Who is this for?
Section titled “Who is this for?”This article is for those who decide on the risk of a piece of equipment or a process, and for those who live with the consequences of that decision: plant manager · process engineer · reliability engineer · maintenance engineer · operator · quality specialist · HSE · Lean/CI coordinator.
Learning objectives
Section titled “Learning objectives”After reading this article you will be able to:
- calculate the RPN (S × O × D), and interpret the reverse scale of detection;
- distinguish mitigation and detection as two routes to reducing risk;
- recognize when action is required regardless of the RPN (severity of 8–10);
- distinguish system, design (DFMEA) and process FMEA (PFMEA).
In brief
Section titled “In brief”- FMEA is proactive: it ranks the risks before the failure happens, as opposed to reactive, post-failure analysis (root cause analysis).
- The three scored factors: Severity (S) = how big the effect is · Occurrence (O) = how frequent the cause is · Detection (D) = whether we catch it in time. RPN = S × O × D (1–1000): the higher it is, the more urgent the intervention.
- Detection is a reverse scale: the high D value is the bad one (a failure that is hard to detect). Many people get this wrong.
- Risk can be reduced in two ways: mitigation (reducing severity or occurrence) and detection (a better control, an earlier catch).
- A high-severity (8–10) failure mode calls for action on its own, regardless of the size of the RPN.
- Three main types: system FMEA, design FMEA (DFMEA), process FMEA (PFMEA). Each one is a living document: it must be re-assessed on change and after an action.
- Criticality analysis designates which equipment is worth the detailed, resource-hungry FMEA.
Why it matters (the stakes)
Section titled “Why it matters (the stakes)”What is at stake with FMEA is whether you pay for the failure at the drawing board or in the plant. If you skip it, you do not remove the risk — you only stop knowing about it.
Attention then goes where the complaint is loudest, not where the risk is greatest: the rare but catastrophic failure mode stays invisible for years. There is no control on it either, so no early signal, and the failure arrives together with its effect. The fate of the maintenance budget is decided the same way: a machine whose outage does not hurt gets the surveillance, and the critical one gets it only once it is already down.
What is FMEA, and where does it come from?
Section titled “What is FMEA, and where does it come from?”FMEA is a risk-analysis method that came out of defence-industry reliability engineering and is industry-independent today; it collects and ranks potential failure modes before they occur.
In the 1940s–60s the US defence industry and space programme developed it for reliability-critical systems, and the automotive industry then turned it into a widespread quality standard. Today it is used in any industry, from manufacturing through pharmaceuticals to the process industry. Its strength is that it handles high complexity, quantifies risk uniformly, and leaves a documented trail of the corrective actions.
FMEA is one of the engines of reliability-centred maintenance: criticality analysis picks out the critical few to be examined, root cause analysis uncovers the root of failures that have already happened, and RCM derives the maintenance tactic from the FMEA’s failure modes. When the analysis also contains the criticality classification, it is called FMECA (Failure Mode, Effects and Criticality Analysis).
How is the RPN calculated?
Section titled “How is the RPN calculated?”The risk priority number is the product of the three scored factors: RPN = severity (S) × occurrence (O) × detection (D), each typically on a 1–10 scale, so the result falls between 1 and 1000.
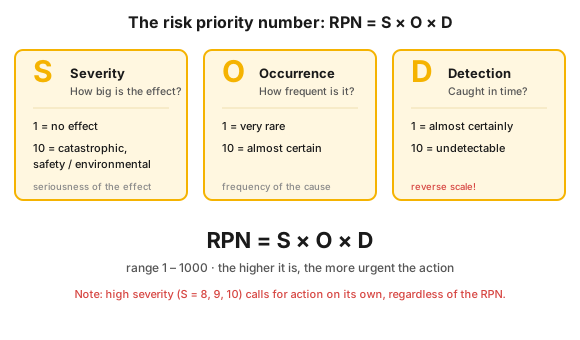 Figure 2 — the risk priority number is the product of the three factors, each typically on a 1–10 scale; the scale itself is fixed by the organization.
- Severity (S): how big is the effect if the failure occurs? The scale runs from negligible (1) to catastrophic (10). The four categories of the classic military standard are still a good handhold: I. catastrophic (fatality, loss of system), II. critical (severe injury, major damage), III. marginal (minor injury, delay), IV. minor (unscheduled maintenance).
- Occurrence (O): how often does the cause occur? The estimate rests on history, professional judgement and statistical data (1 = very rare, 10 = almost unavoidable).
- Detection (D): does the control system detect the failure or its cause before it takes effect? A reverse scale: 1 = we almost certainly catch it, 10 = there is no chance of detection.
There are two traps in the scoring: the scale is organization-specific, so it must be piloted first, and the same scale must be applied to all three factors so that none of them skews the result. Non-continuous numbers (1, 3, 5, 7, 10) separate the values better than 1–5. The RPN is always a relative priority.
The FMEA worksheet
Section titled “The FMEA worksheet”The analysis is made in a table (a worksheet) in which every row is one failure mode:
| Column | What it records |
|---|---|
| Item / process step | Which part, subsystem or step? |
| Function | What is it there to do? |
| Failure mode | What can go wrong? |
| Effect(s) | What is the consequence for the system or for people? |
| S | The severity of the effect (1–10) |
| Classification | Whether it is a critical or a significant characteristic |
| Cause(s) | Why does the failure mode occur (root cause)? |
| O | The frequency of the cause (1–10) |
| Prevention control | What prevents the cause? It reduces O |
| Detection control | What notices it before the effect? It reduces D |
| D | How well we detect it before the effect (1–10) |
| RPN | S × O × D |
| Recommended action | What do we do about the risk? |
| Owner + deadline | Who, by when? |
| New S/O/D + new RPN | The re-assessment after the action |
Splitting the controls in two is not a formality: the prevention control moves occurrence, the detection control moves detectability, so the two columns map the mitigation–detection choice. If you have a single control column, mark the type with a (P) or (D) letter.
When collecting the failure modes, the five failure-mode types work as a checklist: complete failure, partial failure, intermittent failure, operation outside specification, unintended operation. The last columns are the crucial ones: the value of an FMEA is not filling in the table but the action and the follow-up check.
The method step by step
Section titled “The method step by step”An FMEA can be carried out in ten steps: from describing the process, through scoring the failure modes, to the actions and the re-assessment.
- Describe the product or process, and review its block diagram.
- Break it down into items and steps in enough detail for the risk to be scorable.
- For each item, list all potential failure modes.
- Describe the effect of every failure mode, and assign the severity (S).
- Identify the causes of the failure mode, and assign the occurrence (O).
- List the prevention and detection controls, and assign the detection (D).
- Calculate the RPN = S × O × D value.
- For the high-RPN and the high-severity (8, 9, 10) failure modes, define an action, with an owner and a deadline.
- After the actions, re-assess S/O/D, and calculate a new RPN.
- Update the FMEA at every significant design or process change.
The plant-level process FMEA splits this into four repeating phases that never end:
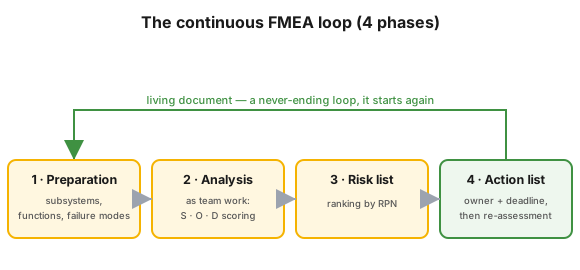 Figure 3 — the four-phase continuous loop of FMEA: preparation → analysis (as team work) → risk list → actions, then it starts again.
- 1. Preparation: drawing the boundaries of the subsystems, pre-filling the functions and the possible failure modes; the result of the HAZOP is good input data.
- 2. Analysis (team work): the parameters and permitted ranges of the inlet and outlet streams; if a parameter leaves its range, that is a failure mode. This is where S, O and D are scored.
- 3. Risk list: ranking the failure modes by RPN, typically on a Pareto chart.
- 4. Actions: an action, an owner and a deadline for the high-risk items, then the re-assessment of the new S/O/D and RPN. With this the loop starts again.
The main types of FMEA
Section titled “The main types of FMEA”There are three main types, according to what they analyse: the system FMEA looks at the interactions of the subsystems, the design FMEA (DFMEA) at the design itself, and the process FMEA (PFMEA) at the steps of the manufacturing or operating process.
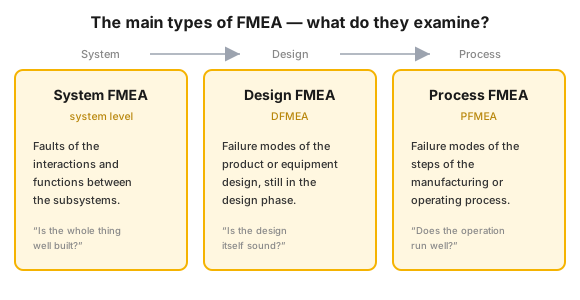 Figure 4 — the three main FMEA types, from system through design to process.
- System FMEA: faults of the interactions between the subsystems and of the functions: “is the whole thing well built?”.
- Design FMEA (DFMEA): the failure modes of the design of the product or equipment, already in the design phase: “is the design itself sound?”.
- Process FMEA (PFMEA): the failure modes of the steps of the manufacturing or operating process: “does the operation run well?”. In the process industry the PFMEA is the most common: it analyses a complex system (e.g. a plant) through pre-defined subsystems, and its output is a list of critical equipment, which is at the same time the input of the next level, the design FMEA.
The types cascade: the effect at one level is the failure mode of the level above, so a component-level analysis adds up at subsystem and then at system level.
Risk reduction: mitigation vs. detection
Section titled “Risk reduction: mitigation vs. detection”The RPN of a failure mode can be reduced in two ways:
- Mitigation: changing the step or the design so that the effect (S) or the likelihood (O) of the failure goes down. This requires eliminating the root cause; on the worksheet the prevention control column carries it.
- Detection: an additional physical or analytical control, possibly real-time feedback; this is the detection control column. Feedback can reduce severity as well.
Action priority. The team fixes an RPN threshold, in process-industry practice typically around RPN = 100. The role of the threshold, however, is not automatic compulsion to act but an elevated review. Independently of it, an action must always be proposed for the high-severity (8, 9, 10) failure modes. The remaining residual risk has to be recorded and periodically reviewed, so that it does not creep “from medium to high”.
The limits of the RPN, and how the method has evolved
Section titled “The limits of the RPN, and how the method has evolved”The RPN is simple and easy to communicate, but it is not a perfect risk measure. It has five recurring limits:
- Duplicate values. Different S/O/D combinations can give the same RPN: S = 1, O = 8, D = 8 is the same 64 as S = 8, O = 4, D = 2, even though the latter is the loss of the primary function.
- Subjectivity. The scores rest on professional judgement and on the organization’s own scale, which is why the RPNs of different FMEAs cannot be compared.
- A scale full of holes. Many values in the 1–1000 range never arise as an S·O·D product, so the scale is neither continuous nor proportional.
- A disputed detection factor. Some organizations drop D and rank by S × O; this is the criticality number, the established measure of FMECA.
- The threshold as a distorting force. If crossing the threshold means a sanction, the team starts tuning the scores downward, and the method turns into a numbers game.
That is why severity must always be watched separately: high severity is high risk on its own. This logic was codified by the automotive AIAG-VDA (2019) methodology, which introduced the Action Priority (AP) table in place of the RPN: it maps the combination of S, O and D onto high / medium / low priority, putting severity in the foreground.
Industrial and safety context
Section titled “Industrial and safety context”The logic of FMEA is industry-independent, but it is particularly valuable in the process industry, because on the consequence side the safety and environmental effect dominates. In a major-hazard (Seveso) plant severity does not come from the repair cost but from the potential for a release, a fire or an injury: this is why high-severity failure modes carry an unconditional obligation to act. The input of a process FMEA is often given by the HAZOP, and its output is the list of critical equipment, which feeds criticality analysis and RCM.
Worked example — centrifugal pump FMEA (extract)
Section titled “Worked example — centrifugal pump FMEA (extract)”The extract below shows the full logic on a single piece of equipment; the S/O/D values are illustrative. Item / function: centrifugal pump, delivering liquid at the specified pressure and flow rate.
| Failure mode | Effect | S | Cause | O | Control | D | RPN | Action (tactic) |
|---|---|---|---|---|---|---|---|---|
| Mechanical seal leaks | Release of process fluid, fire and environmental risk, forced shutdown | 8 | seal wear, ageing, dry running | 4 | visual check on the operator round | 5 | 160 | seal condition programme; on critical duty a tandem seal and flush (CD/TD) |
| Bearing failure | The machine stops, secondary damage to the shaft | 7 | lack of lubrication, unbalance, misalignment | 4 | vibration diagnostics, temperature trend | 3 | 84 | vibration condition monitoring, lubrication programme, laser alignment (CD) |
| Cavitation, impeller erosion | Loss of flow and pressure, impeller damage | 5 | insufficient NPSH, blockage on the suction side | 5 | suction-pressure measurement, flow trend | 4 | 100 | securing NPSH, strainer-cleaning routine, level alarm (CD) |
The priority is clearly visible: the seal leak with the highest RPN (160) comes first, and since its severity falls into the high band (S = 8), it calls for action regardless of the RPN. The control column at the same time designates the maintenance tactic: vibration diagnostics and the suction-pressure trend are condition-based (CD) tasks, the seal-replacement programme is time-based (TD).
Putting it into practice
Section titled “Putting it into practice”An FMEA is not an individual task but facilitated team work: the success of the introduction depends on who sits at the table, and on whether the scope was clarified in advance.
- Team: a facilitator, a team leader, a minute-taker and the functional experts of the key areas (engineering, operations, quality, reliability, maintenance, HSE). Involve the stakeholders responsible for implementation as well, otherwise the action will not be realistic.
- The facilitator’s job: stating the scope, keeping to the time frame, stopping the discussion from wandering off, recording the decisions and scheduling the next meeting.
- Scope and degrees of freedom: fix in advance what the team analyses, how far its responsibility extends, and what the deadline is.
- Bottom-up data collection with fresh data, then pilot the scale on a few examples, and keep it as a living document: the loop in Figure 3 never closes.
Hands-on
Section titled “Hands-on”- Make a three-row FMEA for a piece of equipment you know: 3 failure modes, S/O/D scoring, RPN, and one action for the highest RPN, with an owner and a deadline.
- A 90-minute mini-workshop: 10 minutes scope and scale, 30 minutes collecting failure modes (the five types as a checklist), 25 minutes scoring, 15 minutes ranking and actions, 10 minutes closing.
Common mistakes
Section titled “Common mistakes”The traps are not in the methodology but in how it is used: the table gets made, and then nothing happens. Mistakes and good practice in pairs:
- Misreading detection: a high D is the bad one, not the good one. Correctly: put the definition of the scale into the header of the worksheet.
- Only the table gets filled in, without an owner and a deadline, so the FMEA “goes on the shelf”. Correctly: every high-risk row should have an owner, a deadline and a re-assessment date.
- Treating it as a one-off exercise. Correctly: the review is a recurring event in the calendar, and every change restarts the loop.
- Too coarse a breakdown, which makes the scoring inaccurate. Correctly: break it down until the failure mode is unambiguously scorable.
- Looking only at the RPN. Correctly: keep the rows with severity 8–10 on a separate list.
- Pushing the RPN down: if crossing the threshold means a penalty, the team tunes the scores below the threshold. Correctly: the threshold triggers a review, not a sanction.
- A one-sided team (engineers only). Correctly: the failure modes should be seen by the person who lives with the machine.
- Not recording the residual risk. Correctly: the post-action S/O/D and RPN should go onto the worksheet as well.
When NOT to use it (the limits of the method)
Section titled “When NOT to use it (the limits of the method)”FMEA is a strong tool for proactive risk discovery, but it is not the right answer to every question. Even for a simple system it produces a large output, ranking is hard with competing failure modes, and it requires significant effort to clarify the terms and to assign the scores.
| Situation | Why not primarily FMEA | The right answer |
|---|---|---|
| The failure has already happened | FMEA looks forward, working with hypothetical failure modes | root cause analysis, the 5 whys |
| A certified safety function is needed | the RPN is a subjective ranking, not an audited protection layer | LOPA / SIL, design to IEC 61511 |
| You would run it on every asset | it is resource-hungry, the output swells beyond control | criticality analysis first |
| The question is the time course or an environmental condition | FMEA looks at one failure mode at a time, statically | HAZOP, scenario analysis |
| You are interested in the joint effect of combined failures | FMEA assumes a single failure | fault tree analysis (FTA), black swan event |
Rule of thumb: keep it simple. Easily answerable questions, engineering approximations, limited depth: nobody will finish an over-complicated FMEA. And since it is time-consuming, start as early as possible, while the design is still cheap to change.
Take it home (keys)
Section titled “Take it home (keys)”- Narrow down first, analyse afterwards. Criticality analysis designates where the detailed FMEA pays off.
- List high severity separately. Propose an action for failure modes with S of 8–10 even when the RPN is low.
- The RPN threshold starts a review, not a sanction. Tie it to a penalty and people will pull down the scores, not the risk.
- Ask this of every control: does it prevent (O) or detect (D) the failure? That decides what you improve.
- The table is not the result. The result is the owner, the deadline and the new S/O/D. Start early, keep it simple.
Self-test
Section titled “Self-test”- A failure mode: S = 8, O = 3, D = 6. What is the RPN?
- Two failure modes with the same RPN, but one of them has a severity of S = 9. Which do you tackle first, and why?
- If you improve detection with a better sensor, which of S/O/D goes down, and which does not?
Answer key: 1) RPN = 8 × 3 × 6 = 144. · 2) The one with S = 9: high severity is high risk on its own, so it calls for action regardless of the RPN. · 3) D; S and O do not, because a better sensor changes neither the size of the effect nor the frequency of the cause.
How does this show up in digital practice?
Section titled “How does this show up in digital practice?”The logic of FMEA does not stop at the filled-in table: the same failure mode–control–action chain is realized in software too, in a maintenance and condition-monitoring system. The mechanism differs, the principle is the same.
| FMEA element | Digital implementation | What it delivers |
|---|---|---|
| Failure-mode list for one asset | a failure-mode catalogue tied to the asset master record | the analysis lives at the asset, not in a separate file |
| Prevention control (O) | scheduled work order, lubrication and alignment programme | the control is not forgotten, the execution is logged |
| Detection control (D) | condition-based alarm, digital inspection round | the failure signals before its effect |
| Risk ranking | asset-condition dashboard, filtering by criticality | attention goes where the risk is greatest |
| Action, re-assessment | action list with owner, deadline and new scoring | the FMEA stays a living document |
Connection to OPEREX (shift log)
Section titled “Connection to OPEREX (shift log)”The output of an FMEA is “operator-friendly”: the detection controls are typically operator checks and points on the operator round. A digital shift log (OPEREX) keeps these as items that can be ticked off shift by shift, and carries the deviations of high-RPN and high-severity equipment from the outgoing to the incoming shift with priority and escalation. This way the FMEA stays alive, and gives an audit trail of whether the controls are working.
Terminology (HU / EN)
Section titled “Terminology (HU / EN)”| Hungarian | English (canonical) | Abbreviation |
|---|---|---|
| Hibamód- és hatáselemzés | Failure Mode and Effects Analysis | FMEA |
| Hibamód-, hatás- és kritikusságelemzés | Failure Mode, Effects and Criticality Analysis | FMECA |
| Hibamód / Hatás | Failure mode / Effect | — |
| Súlyosság | Severity | S / SEV |
| Előfordulás | Occurrence | O / OCC |
| Észlelhetőség | Detection / Detectability | D / DET |
| Kockázati prioritásszám | Risk Priority Number | RPN |
| Akció-prioritás | Action Priority | AP |
| Terv-FMEA | Design FMEA | DFMEA |
| Folyamat-FMEA | Process FMEA | PFMEA |
| Megelőző kontroll | Prevention control | — |
| Észlelő kontroll | Detection control | — |
| Kritikussági szám | Criticality Number | S × O |
| Reziduális kockázat | Residual risk | — |
What does the abbreviation FMEA mean, and what is it for?
Failure Mode and Effects Analysis. Its purpose is the prevention of failures: it identifies how an item can fail, with what consequence, why, and how detectable it is, then reduces the risk by aligning it with its source.
How is the RPN calculated?
RPN = Severity (S) × Occurrence (O) × Detection (D), each factor typically on a 1–10 scale. The result is between 1 and 1000; the higher it is, the more urgent the intervention. The scale itself is fixed by the organization.
Why is the detection scale "reversed"?
Because the high value is the bad case: 10 means that we practically cannot detect the failure before its effect, while 1 means we almost certainly catch it. A good control gives a low D.
What is the difference between FMEA, FMECA and criticality analysis?
FMEA analyses the failure modes and their effects; FMECA adds the classification by criticality (typically with the S × O criticality number). Criticality analysis, in turn, first designates which equipment is worth a detailed FMEA.
When must action be taken on a failure mode?
If the RPN goes above the threshold fixed by the team (in process-industry practice typically RPN = 100), or if the severity falls into the high band, that is, a value of 8, 9 or 10, regardless of the size of the RPN. The role of the threshold is the elevated review, not automatic compulsion to act. After the action, S/O/D must be re-assessed.
Related concepts
Section titled “Related concepts”criticality analysis | root cause analysis | reliability strategy and RCM | preventive maintenance | reliability KPIs | HAZOP | LOPA / SIL | Six Sigma | DMAIC
Next step
Section titled “Next step”From here it is worth going on, in this order:
- criticality analysis — which equipment is worth running a detailed FMEA on at all.
- reliability strategy and RCM — how you derive the maintenance tactic from the failure modes (RCM).
- root cause analysis — what to do once the failure has already happened.
References / further reading
Section titled “References / further reading”- IEC 60812:2006 — Analysis techniques for system reliability: Procedure for failure mode and effects analysis (FMEA). The international standard of the method.
- MIL-STD-1629A (its predecessor being MIL-P-1629, 1949) — the first standardized procedure for FMEA; the severity categories I–IV come from here.
- SAE J1739 (2009) — Potential Failure Mode and Effects Analysis. The automotive reference for design and process FMEA.
- AIAG & VDA: FMEA Handbook, 1st edition, 2019 — the harmonized automotive methodology; this is where the Action Priority (AP) logic appeared.
- Carl S. Carlson: Effective FMEAs. Wiley, 2012 — the standard practical work on leading FMEAs, including a discussion of the limits of the RPN.
- ISO 17359:2011 — Condition monitoring and diagnostics of machines. With typical failure-mode tables for nine machine types.