Financial vs. management reporting
≈ 17 min read · 3,486 words
You shipped the big lot, the invoice went out, the month is profitable on paper. Yet there is still nothing in the bank account, because the customer pays in thirty days. It is familiar at home too: your payslip arriving does not mean you can go shopping. In the plant this same difference decides daily choices, and this is where the two reporting worlds part ways. Let’s look at what the financial and the management report mean, what the difference between them is with examples, and which one may be used for what.
A financial report serves the outside world under fixed rules; a management report serves internal decisions under freely chosen logic. The financial statements are the official record of the company’s financial activity for investors, creditors and authorities, under international or local accounting rules. The management report (management reporting) is an analysis built on these same statements that gives leadership a more detailed picture behind the numbers, and serves control, cost management and decision-making. The two do not compete: from the same operational reality they answer different questions, so in the performance management system each has its own place.
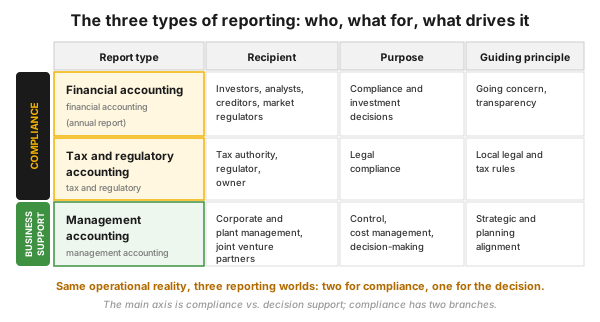
Figure 1 — the three types of reporting: two serve compliance, one serves the business decision.
Who is this for?
Section titled “Who is this for?”For those who get asked: “how much does this cost, and how much does it bring?” plant manager · shift supervisor · technologist · maintenance manager · reliability engineer · controller · project engineer · HSE manager · Lean/CI coordinator.
Learning objectives
Section titled “Learning objectives”After this you will be able to:
- separate the two reports by recipient, purpose and rule;
- justify why profit is not equal to cash;
- translate an operational improvement onto the lines of the income statement and the balance sheet;
- interpret a plan-actual variance analysis, and recognize the reporting pitfalls.
In brief
Section titled “In brief”- There are not two, but three reporting worlds: financial and tax and regulatory accounting serve compliance, management accounting serves decision support.
- The raw material is shared: both work from the same voucher and general ledger, built on the same three statements.
- Profit is not cash. The income statement is accrual-based: revenue arises on performance, not on payment.
- The management report has no mandatory format, so it is fast and plant-tailored; in exchange it is not audited.
Why it matters (the stakes)
Section titled “Why it matters (the stakes)”A bad report turns into a well-intentioned but wrong decision. In three ways:
You decide late: a shift-level decision that waited for the monthly close is made weeks after the loss.
You are profitable, yet you run out of cash: slow collection shows up in the capital tied up, not in profit.
You do not see the most expensive loss: financial accounting was not built for the cost of poor quality.
What is the financial report, and who is it for?
Section titled “What is the financial report, and who is it for?”The financial report is made for the external users, under a mandatory set of rules, and gives a credible, comparable picture of the company as a whole: its recipients compare companies against each other, which is why the rule cannot be chosen freely.
- Rule framework. Alongside the local requirements (GAAP), the standards of the international accounting standard board: IFRS and, under the older name, IAS.
- Basic assumptions. Accrual basis accounting and going concern.
- Complete set of statements. Balance sheet, income statement, the statement of changes in equity, cash flow statement, notes.
- Principles. Matching (the related expense beside the revenue), accrual and prudence: revenue only if collection is reasonably certain, cost immediately.
- Attestation. An independent auditor audits it.
What is the management report, and who is it for?
Section titled “What is the management report, and who is it for?”The management report is made for internal use, without a mandatory format: it serves control, cost management and the decision, its guiding principle being strategic and planning alignment. Management accounting is the system, the management report is the product: it breaks the numbers down by product, plant, shift, customer, and where needed, corrects them.
The cleanest example is the functional income statement: the financial statement breaks costs down by cost type (material, personnel, depreciation), the management view by function (production, sales, research and development, administration). Same money, different cut, different decision.
Reporting itself is worth reviewing with the logic of the VSM: who is the customer, what is the value, what can be dropped.
What is the difference between the financial and the management report?
Section titled “What is the difference between the financial and the management report?”The difference lies in four things: who it is for, what it is for, what rule binds it, when it is available.
| Aspect | Financial report | Tax and regulatory report | Management report |
|---|---|---|---|
| Recipient | investors, analysts, creditors | tax authority, regulator, owner | corporate and plant management, partners |
| Purpose | compliance, investment decision | legal compliance | control, cost management, decision |
| Rule | mandatory (IFRS or local GAAP) | mandatory, statutory | no mandatory format |
| Frequency | quarter, year | as prescribed by law | from daily to monthly, by business rhythm |
| Breakdown | company, segment | taxable entity | plant, line, product, shift |
| Time horizon | past; accuracy | past; legality | past and future; timeliness |
| Auditable | yes, an auditor attests it | yes | internal control, not audited |
The three statements: the common raw material
Section titled “The three statements: the common raw material”Both reporting worlds are built on the same three statements, only cut differently: the balance sheet is a snapshot of one day (assets = equity + liabilities), the income statement is the film of a period (from revenue through EBIT to net result), the cash flow statement is the bridge connecting the two.
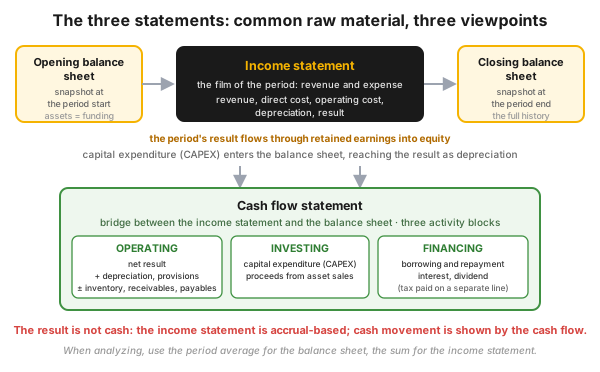
Figure 2 — the three statements and the relationship between them.
The period’s result flows into equity through retained earnings; reading it line by line is the subject of the three financial statements article.
Why is profit not equal to cash?
Section titled “Why is profit not equal to cash?”Because the income statement is accrual-based: you record revenue on performance and cost when the obligation arises, independently of the cash movement. When a provision is set aside, an expense arises without cash moving; when it is used, cash goes out without expense.
The bulk of the difference sits in working capital (receivables + inventory − payables). The time gap that comes with it is the cash-gap, split into three day-metrics (DSO, DIS, DPO), and priced by the financing cost of the capital tied up.
How does an operational improvement become money?
Section titled “How does an operational improvement become money?”The operational improvement reaches the operating items and the depreciation in the income statement, and the assets and the current liabilities in the balance sheet; it affects long-term funding and equity indirectly.
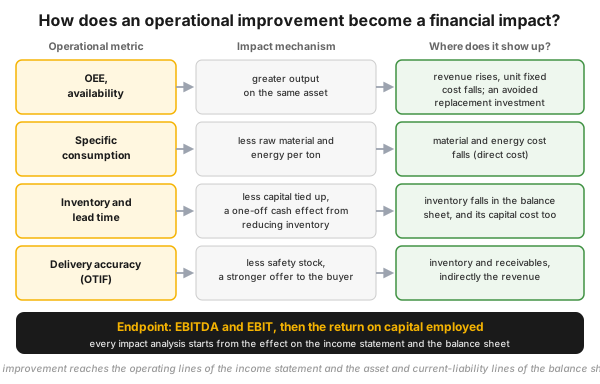
Figure 3 — the path leading from the operational metric to the line of the financial statement.
- OEE and availability. Higher volume is not only revenue: it can make a replacement investment unnecessary, so it also improves the net fixed assets / revenue ratio.
- Specific consumption. Lower raw material and energy use drives down the direct production cost.
- Inventory. Frees up the capital tied up, improves asset turnover, and reducing the excess is a one-off cash inflow; the annual cost of holding inventory (warehouse, handling, insurance) is roughly 25 percent of the product value.
- Lead time and delivery accuracy (OTIF). Reduces safety stock, and through the better offer affects revenue.
The economic view of the balance sheet makes it visible: it rearranges the numbers according to how much capital is needed to operate and from what we finance it, so the cost of capital becomes quantifiable.
How do you read a variance analysis?
Section titled “How do you read a variance analysis?”The variance analysis (plan-actual bridge) breaks down what moved the result away from the plan or the base: into external (no influence over) and internal (you have) effects.
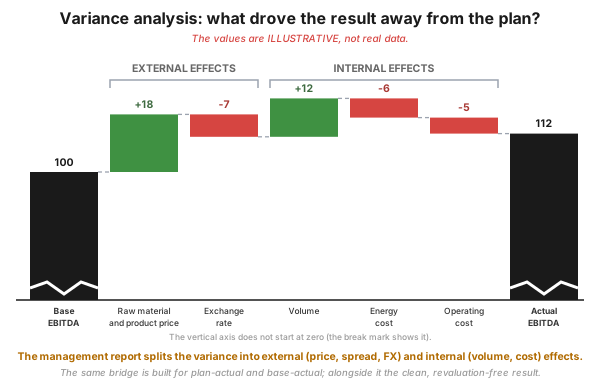
Figure 4 — variance analysis as a waterfall chart, with illustrative values: the structure is the point, not the numbers.
- External effects: raw material and product price, the price spread between raw material types (spread), raw material discount, exchange rate, margin, market size.
- Internal effects: volume, energy cost, other material cost, operating cost, the capitalized value of own-produced inventory.
The bridge is drawn in two comparisons: plan-actual (against your own promise) and base-actual (against last year’s self).
The management view goes beyond accounting here: alongside the accounting result it also computes a cleaned metric that filters out inventory revaluation. If the raw material price falls, the inventory is written down, and the result shows a deterioration independent of the plant.
What metrics do the two reports use?
Section titled “What metrics do the two reports use?”Most of the metrics are shared, only the viewpoint differs: financial analysis measures the company as a whole, the management report breaks it down to plant, line, product.
| Category | What it measures | Typical metric |
|---|---|---|
| Liquidity | is there enough cash for short-term obligations | current ratio, quick ratio |
| Profitability | how much result falls on revenue and capital | EBITDA margin, EBIT margin, ROCE, ROOC |
| Activity (turnover) | how much output the asset gives | asset turnover, inventory turnover, DSO |
| Leverage | can it bear the long-term debt | net debt / equity |
The typically management metrics take a contribution view: the value added is net revenue minus raw material cost, the contribution is net revenue minus the variable costs, that is, what remains for the fixed costs. Behind it is a dual, independent cost breakdown:
| Direct (assignable to the product) | Indirect (not assignable to it) | |
|---|---|---|
| Variable (proportional to activity) | raw material, process energy, transport | auxiliary material, variable overhead |
| Fixed (payable even at zero output) | the wage of the core crew on the line, the depreciation of the line asset | administrative wage, rent, insurance |
The fixed cost must be paid even at zero output, so the fixed cost per unit falls as volume grows; the break-even point is where revenue covers all costs.
The return on capital employed (ROCE = EBIT / capital employed) is the common language of the two worlds: value is created when it exceeds the pre-tax cost of capital.
What do you see of this in the management report?
Section titled “What do you see of this in the management report?”The monthly management report comes down to a few lines, and those consist of your daily decisions.
| What you see in the report | What moves it in the plant | What you can do with it |
|---|---|---|
| contribution and contribution margin | volume, product mix, specific material and energy use | which way the load and the recipe move it |
| operating cost line by line | maintenance, energy, auxiliary material, overtime | which item deviates from the plan, and why |
| inventory and receivables | safety stock, production cycle, invoicing lead time | the capital tied up that you can free up |
| variance analysis (plan-actual) | external price and FX effect vs. internal volume and cost | which deviation you are truly responsible for |
The rule: argue the half of the report you have influence over; if it does not separate the external and internal effect, ask that it be separated (the performance dialogue).
Process-industry and safety context
Section titled “Process-industry and safety context”Three particularities make the two reports part ways sharply here.
Capital intensity. The asset base of process-industry plants is typically carried in the books with a depreciation period of between 4 and 12 years, buildings between 10 and 50, and gas and oil storage facilities between 7 and 50 years; land is not depreciated. The large item of the cost structure is therefore not a cash movement.
Large inventory and tank farm. Raw material, work-in-progress and finished product are significant capital tied up, and the technological minimum stock is judged separately; the production accounting and material balance is a financial item too.
Turnaround. The cost of a major overhaul is typically capitalized and written down over the next cycle; a postponed turnaround improves the cost line.
Introduction in practice
Section titled “Introduction in practice”- Ask for the income statement and balance sheet lines of your unit, and mark the ones you affect.
- Link your operational metrics to them, so every KPI has a financial path (KPI definition).
- Calculate the annual effect of an improvement: hypothesis, volume, contribution, avoided direct cost.
- Put the lines onto the performance board, with an owner, on the agenda of the weekly performance dialogue.
- Measure back monthly on a plan-actual basis, split into external and internal effect.
Hands-on: what happens if you sell for 100 on 30-day terms?
Section titled “Hands-on: what happens if you sell for 100 on 30-day terms?”Fill in the four cells in your head.
| Income statement | Cash flow | Working capital | Balance sheet | |
|---|---|---|---|---|
| On the day of sale | ? | ? | ? | ? |
| 30 days later | ? | ? | ? | ? |
Solution
On the day of sale: net revenue +100; receivables +100; working capital +100; no effect on cash flow.
30 days later: no effect on the income statement; receivables −100, cash +100; working capital −100; cash flow +100.
Lesson: the same event appears in two months: accrual asks about the performance, not about the cash movement.
Measurement / audit: what makes a management report good?
Section titled “Measurement / audit: what makes a management report good?”A management report is good if someone decides from it:
| Check point | What do you look at? |
|---|---|
| Customer | Can you name who reads it, and what decision they make from it? |
| Clarity | Are the unit, the period, the scope unambiguous? Does it compute balance-sheet-type data with an average, income-type data with a sum? |
| Separation | Are the target, the forecast and the resource need distinguished in it? |
| Breakdown | Is the deviation split into external and internal effect, still in time to decide? |
| Follow-up | Is there an action, an owner and a deadline for it? |
The most important is the separation: the target wants to be ambitious, the forecast unbiased, the resource allocation continuous, which is why Beyond Budgeting splits them into separate numbers.
Common mistakes
Section titled “Common mistakes”- Running the budget at once as target, forecast and cap. Instead: separate the three.
- Not turning a payment-term concession into a price. The extra day is an interest-free loan to the customer. Instead: convert every payment-term change into a price.
- Looking for the cost of poor quality in the general ledger. Instead: build a plant loss record (muda), and compute the potential from there.
When NOT to use it? (the limits)
Section titled “When NOT to use it? (the limits)”No report is universal; five situations where a different tool is needed:
| Situation | Why not this | The right answer | ||
|---|---|---|---|---|
| External disclosure (bank, investor, authority) | the management report is not audited | the audited financial statements | ||
| Daily or shift-level decision | the close is delayed and aggregated | an operational metric on the [[performance-board.en | performance board]], in [[mos.en | MOS]] rhythm |
| Comparing an old and a new plant with ROCE | it measures against book value, does not follow inflation | physical and specific metrics, taking asset age into account | ||
| Appraising an investment with a payback metric | it does not account for the timing of cash flows | discounted cash flow (net present value) | ||
| A safety or environmental measure | payback is not the primary consideration | risk-based decision; a below-threshold payback is also acceptable |
Rule of thumb: the financial report tells the truth about the past to the outside, the management report about tomorrow to the inside.
Take it home (keys)
Section titled “Take it home (keys)”- Ask of every report: who reads it, and what do they decide from it? If there is no answer, the report is decoration.
- Argue your own lines, the ones you have influence over; the external effect you only explain.
- Look at inventory and receivables beside the contribution: the cash-gap is your job too.
- For every improvement, state the financial path: on which line, through what mechanism, with how large an effect.
- Do not put the safety limit on the scales.
Self-test
Section titled “Self-test”- You received a supplier invoice but have not yet paid it. In which statement does it appear, and how?
- Why does the cost of the capital tied up not show in the income statement?
- You have to decide on an operating mode tomorrow. From which report do you work, and why?
Answer key: 1) In both: in the income statement as a cost (the performance has occurred), in the balance sheet as a payable; it has no effect on cash flow until you pay. · 2) Because the financing cost of working capital is not a recognized expense, it appears only in the economic view. · 3) From the management report: timely and broken down to your scope.
How does it show up in digital practice?
Section titled “How does it show up in digital practice?”The principle of the management report does not stop at the monthly table: it is a by-product of the work.
| The principle of the management report | Digital implementation | What it delivers |
|---|---|---|
| Timeliness | timestamped event recording at the place of origin | the decision does not wait for the monthly close |
| One datum, many uses | single data entry, for several reports | no parallel, contradictory records |
| Breakdown by cause | categorized loss and downtime causes | the source of the deviation is immediately visible |
Connection to OPEREX (shift diary)
Section titled “Connection to OPEREX (shift diary)”The lowest level of the management report is where the data is created: the shift. In the OPEREX shift diary, downtime, loss, mode change and intervention are recorded still during the shift, so the internal side of the variance analysis is more credible, and the daily rhythm does not wait for the monthly close.
Terminology (HU / EN / JP)
Section titled “Terminology (HU / EN / JP)”| Hungarian | English | Japanese | Note |
|---|---|---|---|
| pénzügyi beszámoló | financial statements | 財務諸表 | |
| vezetői számvitel | management accounting | 管理会計 | the system; the report is its product |
| kontrolling | controlling | 管理会計 | in Hungarian partly overlaps management accounting |
| eredménykimutatás | income statement, profit and loss (P&L) | 損益計算書 | |
| mérleg | balance sheet | 貸借対照表 | |
| cash flow kimutatás | cash flow statement | キャッシュ・フロー計算書 | operating, investing, financing blocks |
| működőtőke | working capital | 運転資本 | |
| fedezet | contribution | 限界利益 | net revenue minus variable cost |
| időbeli elhatárolás | accrual | 発生主義 | |
| céltartalék | provision | 引当金 | a liability of uncertain timing or amount |
| EBITDA | earnings before interest, taxes, depreciation and amortization | 償却前営業利益 | earnings before interest, tax and depreciation |
| üzemi eredmény | EBIT, earnings before interest and taxes | 営業利益 | the numerator of ROCE and ROOC |
| adózás előtti eredmény | EBT, earnings before taxes | 税引前利益 | for comparing companies under different tax regimes |
| tőkeköltség | weighted average cost of capital (WACC) | 加重平均資本コスト | the minimum return to be earned |
| A3-riport | A3 report | A3報告書 | a different concept: a one-page problem-solving format, see the A3 report |
What is the difference between financial and management accounting?
Financial accounting produces a mandatory, rule-based, audited report on the company as a whole for external users (investors, creditors, authorities). Management accounting produces an analysis for internal use, without a mandatory format, in any breakdown (plant, line, product, shift), for control and the decision.
Why is profit not equal to cash?
Because the income statement is accrual-based and also contains non-cash items (depreciation, provisions). The cash flow statement derives the difference, which is largely explained by the change in working capital.
Does a plant manager need to know IFRS?
The detailed knowledge of the standards is not their job. What is worth knowing: which line their decision affects, that profit is not cash, and that the capital tied up has a price.
How do I show the financial benefit of a machine-efficiency improvement?
Frame a hypothesis about which loss decreases; calculate the annual extra volume, multiply it by the contribution, add the avoided direct cost; finally, check whether a replacement investment becomes unnecessary.
Related concepts
Section titled “Related concepts”the three financial statements | KPI definition | KPI, PI and indicator | leading and lagging indicators | performance management | the performance board | the performance dialogue | MOS | OGSM | OEE | profit per hour | muda | VSM | the energy-cost waterfall | production accounting and material balance | asset management (ISO 55000) | the bullwhip effect | the A3 report
Next step
Section titled “Next step”- the three financial statements — the common raw material line by line: the result staircase, the balance sheet, the cash flow.
- KPI definition — designing the metric: definition, unit, source, owner.
- MOS — where the report fits into the management rhythm.
- profit per hour — the financial logic on the plant’s hours.
References / further reading
Section titled “References / further reading”- IFRS Foundation / IASB — IAS 1 Presentation of Financial Statements, IAS 7 Statement of Cash Flows, IAS 37 Provisions.
- Act C of 2000 on Accounting (Hungary) — the basis of local GAAP.
- CIMA and AICPA — Global Management Accounting Principles.
- H. Thomas Johnson – Robert S. Kaplan: Relevance Lost (Harvard Business School Press, 1987).
- Beyond Budgeting Institute (BBRT) — the 12 principles of Beyond Budgeting, bbrt.org.