Design for Reliability (DfR)
≈ 14 min read · 2,854 words
Moving a socket on the drawing at a refurbishment takes a minute; moving it in the finished, painted wall means chiselling, dust and money. With a plant asset the same thing happens, only more expensively: a badly chosen pump keeps charging you for ten years.
Design for Reliability builds reliability into the asset at the design stage, weighing all five RAMS² aspects together instead of patching failures later.
The approach starts from the observation that most in-service failures are the consequence of poor or incomplete engineering design, and that fixing a defect gets an order of magnitude (10×) more expensive in every successive life-cycle phase. The five aspects weighed together at the design table are reliability, availability, maintainability, safety and sustainability (RAMS²). A well-designed asset fails less often, and its total cost of ownership (TCO) is substantially lower.
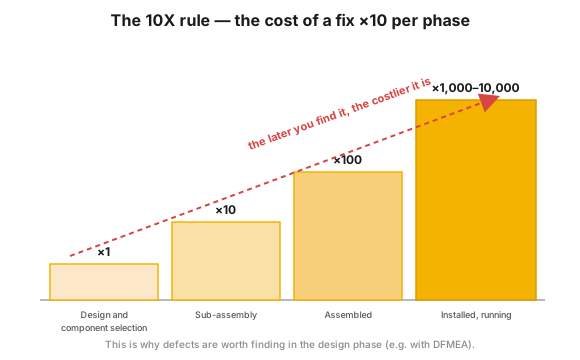 Figure 1 — the 10X rule: the later a design defect surfaces, the more orders of magnitude the fix costs.
Who is this for?
Section titled “Who is this for?”This article is useful for those who live with a new asset, a modification or weak reliability: design and capital-project engineer · reliability engineer · maintenance manager · process engineer · plant manager · HSE specialist · procurement.
Learning objectives
Section titled “Learning objectives”After completing this module you will be able to:
- explain the 10X rule, and why design is the primary source of reliability
- name the elements of RAMS², and what has to be built into the engineering design
- calculate availability, and understand the role and the price of redundancy
- apply the DfR toolkit (QFD/VOC, DFMEA, allocation, RBD, DFMA)
In brief
Section titled “In brief”- The main causes of failure are inadequate engineering design, lack of maintenance or improper use; better design also prevents many human errors.
- The 10X rule: the cost of fixing a defect multiplies tenfold per phase (design ×1 → sub-assembly ×10 → assembled ×100 → installed and running ×1,000–10,000).
- RAMS²: design at the same time for reliability, availability, maintainability, safety and sustainability.
- Availability = MTBF / (MTBF + MTTR): it takes a high MTBF (few failures) and a low MTTR (fast repair).
- ~80% of the life-cycle cost is locked in by design, development and build-up; this is where the fate of reliability is decided.
- Tools: House of Quality (QFD/VOC), DFMEA, reliability allocation, RBD, DFMA.
- The goal is not the lowest but the optimal cost level (the TCO minimum); redundancy raises availability, but it has a price.
Why is design the primary source of reliability?
Section titled “Why is design the primary source of reliability?”According to many industry experts, in-service defects are mostly the result of poor-quality or inadequate engineering design. Design shortcomings are often caused by scarce resources and budget constraints, because it is not visible what life-cycle cost they drag behind them. On top of that, the capital-project manager and the designer are judged on cost and schedule performance, not on the long-term performance of the asset. Design for Reliability turns this around: it builds the principles of reliability into every phase of the capital project.
The cause and effect are simple: unreliable components → higher failure rate → higher operating and maintenance cost, shorter service life. And the disproportion is merciless: according to the literature, as much as 90% of the life-cycle cost is determined by the engineer who designs the asset, while that same 90% is actually incurred only in the operating and maintenance phase, when it is already too late.
What is the 10X rule?
Section titled “What is the 10X rule?”The correction cost grows by an order of magnitude in every successive phase of the asset’s life cycle (Figure 1): design ×1, sub-assembly ×10, assembled ×100, installed and running ×1,000–10,000. The life cycle of an asset consists of six phases (concept, design and development, build-up, installation and commissioning, operation and maintenance, decommissioning and disposal), and the cost multiplier sits exactly on these phases. That is why it pays to find the defects already in the design phase, typically with a DFMEA: the potential failure modes are eliminated by redesign or by reliable, quality components.
What is RAMS², and how do you design for high availability?
Section titled “What is RAMS², and how do you design for high availability?”RAMS² is the set of five aspects that have to be weighed together during design: reliability, availability, maintainability, safety and sustainability. All five are needed because design errors typically cause early (“infant mortality”) failures, and the best way to eliminate these defects is correct design at the source.
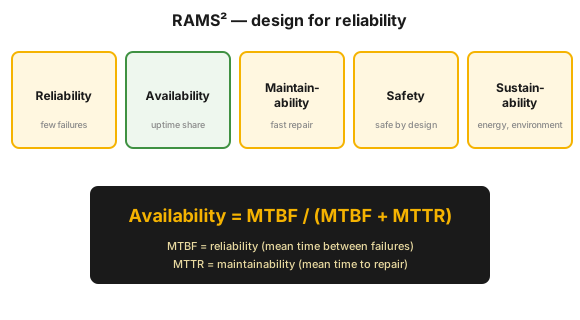 Figure 2 — the five aspects of RAMS² and the availability formula.
Availability is a function of reliability and maintainability:
Availability = MTBF / (MTBF + MTTR) = uptime / (uptime + downtime)
where MTBF (mean time between failures) measures reliability and MTTR (mean time to repair) measures maintainability. High availability therefore has to be designed with components of high MTBF (low failure rate) and low MTTR (fast to repair). To support safety and sustainability, we choose energy-efficient materials that are less hazardous to the environment and operationally safe.
What has to be built into the engineering design?
Section titled “What has to be built into the engineering design?”Reliability and maintainability are design features, so they have to be translated into concrete decisions:
| Design decision | What the plant gains from it |
|---|---|
| High-reliability (high-MTBF) components | fewer failures, longer service life |
| Redundancy where the target demands it | the availability target can be held |
| Easy operability and access | shorter repair time, lower MTTR |
| Built-in condition monitoring and diagnostics | the fault shows up early, the repair is plannable |
| Minimizing the need for special tools | the repair does not stall for want of a tool |
| TPM / ODR / 5S principles in the design: easy belt and chain adjustment, oil filling, lubrication; labelling of pipework, hoses and equipment | the operator can carry the daily care |
| Balance of the reliability and maintainability requirements | one goal does not crush the other |
| Safe and ergonomic design features | fewer injuries during work on the equipment |
| Environmentally clean, energy-efficient components | the two “S” members of RAMS² are met |
| Standardized components, including the control system (PLC) | smaller spare-parts stock, simpler training |
| Performance-measurement data + a plan for collecting them | the designed reliability can be measured back |
| Standardized asset hierarchy and taxonomy | the data are comparable |
The design toolkit
Section titled “The design toolkit”The aspects of RAMS² are turned into an engineering design by proven tools: from gathering the requirements through screening out failure modes to manufacturability.
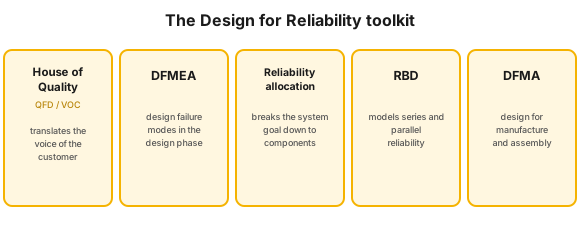 Figure 3 — the proven practices and tools of Design for Reliability.
- House of Quality (QFD / VOC): a house-shaped matrix that translates the “voice of the customer” into design parameters; marketing, engineering and manufacturing already work together at conception.
- Design FMEA (DFMEA): evaluates the engineering design from the standpoint of reliability and resistance to failures, identifying the failure modes already in the design phase (in detail: FMEA).
- Reliability allocation: breaks the system-level target (e.g. “300 operating hours per month, ≥90% reliability”) down to subsystems and components, expressed in MTBF / failure rate, so that every element is designed or selected to the requirement falling on it.
- Reliability block diagram (RBD): modelling reliability and availability (see below).
- DFMA (design for manufacture and assembly): the asset is shaped to be easily and economically manufacturable and assemblable. Its main guidelines: minimized component count, standard commercial parts, modular design, tolerances within the capability of the technology. (About 70% of the production cost is locked in by design decisions, and only about 20% by manufacturing ones.)
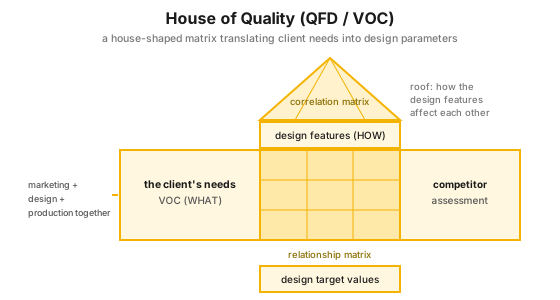 Figure 4 — the structure of the House of Quality: the relationship matrix of the client’s needs (WHAT) and the design features (HOW).
Reliability block diagram (RBD)
Section titled “Reliability block diagram (RBD)”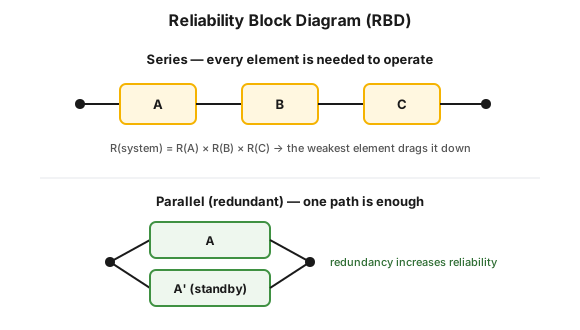 Figure 5 — series and parallel (redundant) configuration in the RBD.
The RBD depicts the logical dependencies between components (series/parallel paths). In a series configuration every element is needed to operate, so the availability of the system is the product of the elements: with three elements that each look good on their own, 0.9 × 0.95 × 0.85 ≈ 0.73, that is, the weakest element drags the whole down. In a parallel (redundant) configuration one path is enough, so redundancy raises availability. From the estimated MTBF/MTTR data the model gives the foreseeable reliability and availability (several software packages support it).
Mechanical integrity (process industry)
Section titled “Mechanical integrity (process industry)”One key area of RAMS² is mechanical integrity (MI), also known as asset integrity management (AIM): caring for the processing equipment (tanks, pressure vessels, pipework) so that it stays resistant and safe under continuous, 24/7 operation. Failure of these systems, for example a leak, overpressure or corrosion, is dangerous and costly. Their design and maintenance comply with the OSHA 1910.119 (process safety management) and API 580/581 (risk-based inspection) standards; the framework: risk management.
Industrial and safety context
Section titled “Industrial and safety context”Design for Reliability is industry-independent, but in the process industry the stakes are especially high: design decisions lock in the risk and the cost of the plant for decades. In a hazardous (Seveso) plant this is a safety question: the two “S” members of RAMS² and mechanical integrity reduce the risk of release, fire and injury at the design table, at the cheapest point. The RBD is not used only for reliability modelling: determining the trip test interval of the interlocks also builds on it, which is a direct link to the logic of SIL/LOPA.
Putting it into practice
Section titled “Putting it into practice”DfR works when it becomes routine in the capital project. Five steps:
- Bring reliability in early: in the concept and design phase, because thanks to the 10X rule this is where the effect is cheapest.
- Ask the operator and the maintainer at the design table: how the new equipment should work, how much retraining it requires, whether its spare parts are interchangeable. Poor installation and foundation quality degrades the designed reliability afterwards.
- Set a reliability target (in RAMS² terms), and allocate it to subsystems and components.
- Use the right tool: VOC/QFD for the requirements, DFMEA for the failure modes, RBD for the configuration, DFMA for manufacturability.
- Close the handover with data: the full documentation and the asset data should get into the CMMS/EAM system, and the design should fix which data are collected; this will be the basis of the reliability KPIs.
Common mistakes
Section titled “Common mistakes”| Anti-pattern | Why it is a problem | Good practice |
|---|---|---|
| Designing to the lowest purchase price | higher TCO, more failures | the optimal cost level, a TCO-based decision |
| “Patching” reliability in afterwards | because of the 10X rule it costs many times more | DFMEA and a RAMS² assessment already in the design phase |
| Measuring the project manager only on cost and schedule | long-term performance and TCO drop out | a reliability target among the project acceptance criteria |
| Redundancy without thinking | duplication is expensive, and does not always help | redundancy backed by an RBD, only where the target justifies it |
| Underrating mechanical integrity | failure of pressure-retaining systems is dangerous | MI/AIM requirements and API 580/581 in the design |
| Handover without data | the asset goes into service, but there is nothing to measure against | CMMS/EAM data handover and a measurement plan as a condition of acceptance |
When NOT to use it? (the limits of the method)
Section titled “When NOT to use it? (the limits of the method)”DfR is strongest while the drawing is still on paper, but it is not the answer to every reliability problem. Failures have three main causes: inadequate engineering design, lack of maintenance or improper use; the latter two are not cured by design.
| Situation | Why DfR is not the answer | The right answer |
|---|---|---|
| The cause of the failure is lack of maintenance or improper use | the design is good, the care or the handling is missing | preventive maintenance, ODR, operator training |
| The asset is already installed and running | the design table has closed, redesign only in a new project | RCM tactics for the remaining failure modes |
| A certified safety function is needed | redundancy on its own is not a certified protection layer | LOPA/SIL, design to IEC 61511 |
| A specific, not yet understood failure keeps recurring | DfR is a design framework, not root-cause investigation | RCA, the lesson fed back into the design |
Rule of thumb: DfR decides the reliability of the next asset; the reliability of the present one is decided by the maintenance tactic and by how it is used.
Take it home (keys)
Section titled “Take it home (keys)”- Decide at the design table, not in the plant. The price of a fix multiplies tenfold with every phase, so the day spent on a DFMEA is the cheapest reliability investment.
- Weigh all five RAMS² aspects: maintainability (low MTTR) contributes as much to availability as reliability does.
- Write the reliability target down as a number, and allocate it down to component level.
- Calculate redundancy, do not feel it: show with an RBD what the plant gains and at what price.
- The handover is done when the data are handed over too: documentation, asset data in the CMMS/EAM, and a fixed measurement plan.
Self-test and practice
Section titled “Self-test and practice”Self-check questions
- MTBF = 900 hours, MTTR = 100 hours. What is the availability?
- Fixing a defect costs 1 unit in the design phase and 100 in manufacturing. How many times is the increase, and what is the lesson?
- Why is the lowest capital cost not the goal?
Answer key: 1) A = 900/(900+100) = 0.90 = 90%. · 2) ~100×, that is, ~10× per phase (the 10X rule); it is worth screening the defect out as early as possible. · 3) Because what counts is the optimum of the total life-cycle cost (TCO); a design that is too cheap causes expensive operation.
Applied exercise
- Draw an RBD for a two-element series system and for a redundant (parallel) one, and say which has the higher availability.
How does it appear in digital practice?
Section titled “How does it appear in digital practice?”DfR steps off the drawing board into software at two points: at the handover, when the asset data get into the maintenance management (CMMS) or asset management (EAM) system, and at the measurement plan.
| Design element | Digital implementation | What it delivers |
|---|---|---|
| Handover of asset data, documentation, drawings | the supplier uploads the CMMS/EAM master data at commissioning | the asset is trackable from day one |
| Standardized asset hierarchy and taxonomy | uniform nomenclature in the CMMS/EAM | the data are comparable |
| “Which data do we collect and how” | fixed measurement points, a data-collection routine | the designed MTBF/MTTR can be measured back |
| Built-in condition monitoring and diagnostics | online condition data, alarm threshold | the fault shows up at the start of the P–F interval |
Connection to OPEREX (shift log)
Section titled “Connection to OPEREX (shift log)”One frequently omitted element of designing for reliability is that we build into the design what we measure and how. These planned measurement points and critical parameters can be recorded and trended shift by shift in the OPEREX shift log, so the actual availability (MTBF/MTTR) is continuously measured back against the designed target. Early (“infant mortality”) failures thus become visible already in the plant’s first weeks, giving feedback to the next design cycle.
Terminology (HU / EN)
Section titled “Terminology (HU / EN)”| Hungarian | English (canonical) | Abbreviation |
|---|---|---|
| Megbízhatóság-központú tervezés | Design for Reliability | DfR |
| Megbízhatóság, rendelkezésre állás, karbantarthatóság, biztonság, fenntarthatóság | Reliability, Availability, Maintainability, Safety, Sustainability | RAMS² |
| Teljes tulajdonlási költség | Total Cost of Ownership | TCO |
| Hibák közti átlagidő | Mean Time Between Failures | MTBF |
| Átlagos javítási idő | Mean Time To Repair | MTTR |
| Az ügyfél hangja | Voice of Customer | VOC |
| Minőségi funkció kibontása | Quality Function Deployment | QFD |
| Tervezési FMEA | Design FMEA | DFMEA |
| Megbízhatósági blokkdiagram | Reliability Block Diagram | RBD |
| Gyártásra és szerelésre tervezés | Design for Manufacture and Assembly | DFMA |
| Mechanikai integritás / eszköz-integritás menedzsment | Mechanical Integrity / Asset Integrity Management | MI / AIM |
The terminology follows the usage of Uptime Elements.
What is Design for Reliability?
The approach that builds reliability, availability, maintainability, safety and sustainability (RAMS²) into the asset already in the design phase, instead of trying to “patch them in” afterwards.
What is the 10X rule?
The cost of fixing a design defect multiplies tenfold in every life-cycle phase: design ×1, sub-assembly ×10, assembled ×100, installed and running ×1,000–10,000. That is why it pays to find the defect at the design table.
How do you calculate availability?
Availability = MTBF / (MTBF + MTTR), that is, uptime / (uptime + downtime). Example: with a 900-hour MTBF and a 100-hour MTTR the availability is 90%.
What is the difference between a series and a parallel RBD?
In a series configuration the availability of the system is the product of the elements (0.9 × 0.95 × 0.85 ≈ 0.73), and the weakest element drags the whole down. In a parallel (redundant) configuration one path is enough, so redundancy raises availability, at the price of extra cost.
What is the connection between Design for Reliability and RCM?
Design (DfR) prevents failure modes at the source, while reliability-centered maintenance (RCM) assigns a maintenance tactic to the remaining failure modes. RCM is worth taking into account already in the design phase, because that is where its effect is greatest.
Related concepts
Section titled “Related concepts”FMEA | reliability strategy | criticality analysis | reliability KPIs | risk management | asset management (ISO 55000) | preventive maintenance | root cause analysis
References / further reading
Section titled “References / further reading”- OSHA 29 CFR 1910.119 — Process Safety Management of Highly Hazardous Chemicals: mechanical integrity as a mandatory PSM element.
- API RP 580 / API RP 581 — Risk-Based Inspection: the methodology of risk-based inspection of pressure-retaining systems.
- ISO 55000 — the asset management standard family; this is the origin of the “an asset is what delivers value” definition (see asset management (ISO 55000)).
- Chang, Wysk, Wang: Computer-Aided Manufacturing (2nd edition) — the source of the 70% / 20% DFMA cost split.
- QFD / House of Quality — the design matrix of quality function deployment, for translating the Voice of Customer into technical parameters.
- Reliabilityweb.com — Uptime Elements reliability framework (CRL): DfR is an element of the Reliability Engineering for Maintenance domain.