Oil and fluid analysis
≈ 12 min read · 2,430 words
A blood test is not about the blood: the doctor reads the state of the body out of it. It is exactly the same with lubricating oil: the metal particles floating in the sample tell you nothing about the oil, they tell you what is wearing away inside.
Oil and fluid analysis is the laboratory testing of lubricants that reveals the wear condition of the machine, not primarily of the lubricant.
The wear metals appearing in the lubricant (iron, aluminium, copper, lead) give away the wear of the internal parts, and this is the only direct means of identifying wear without a visual inspection. It also detects the condition of the lubricant (oxidation, water, viscosity) and contamination (particle count). Because root causes such as water, dust or fuel ingress show up in the lubricant, it is regarded as the most valuable element of machine condition monitoring (MCM).
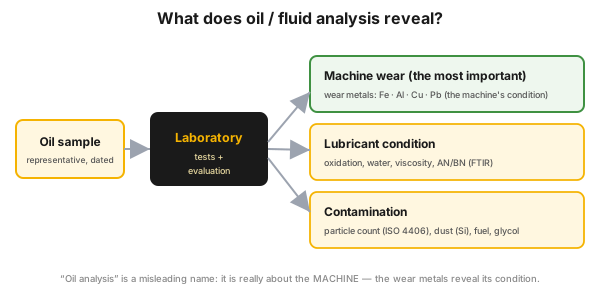 Figure 1 — the three outputs of the analysis; the most important is machine wear.
Who is this for?
Section titled “Who is this for?”For those who decide about the condition of rotating equipment, or have to live with the decision: maintenance engineer · reliability engineer · condition monitoring specialist · lubrication technician · plant manager · operator.
Learning objectives
Section titled “Learning objectives”After this article you will be able to:
- choose the test that fits the component from the five routine tests;
- take a valid sample, and recognize a cold-taken sample;
- read an evaluation using the colour code and the urgency level;
- decide when vibration analysis is the stronger tool.
In brief
Section titled “In brief”- “Oil analysis” is a misleading name: fluid analysis is about the machine, not (only) about the lubricant.
- Three outputs: machine wear (wear metals), the condition of the lubricant, contamination.
- Five routine tests: spectrometry, ferrous particle screening (PQ/DRF), viscosity, FTIR, particle counting (ISO 4406).
- Wear metals are flagged above a limit value and trended: the rate of the rise is more telling than the absolute value.
- The deliverable of fluid analysis is the evaluation, and that is the key to ROI; the second benefit, qualifying the lubricant, allows a longer oil change interval.
Why it matters (the stakes)
Section titled “Why it matters (the stakes)”Internal wear either comes to light in the sample, or on the wrecked machine. If you only open up the gearbox that is already noisy, the time and the price of the repair are dictated by the failure.
The other price shows up at the lubricant: without analysis the oil change happens by the calendar, so either you throw out good oil, or you keep running degraded oil. Qualifying the lubricant therefore often pays back a significant part of the cost of a programme.
What is fluid analysis, why is it about the machine, and what tests does it consist of?
Section titled “What is fluid analysis, why is it about the machine, and what tests does it consist of?”Fluid analysis is a technology of machine condition monitoring (MCM): five routine tests run on a representative lubricant sample, and the result shows the condition of the machine.
The turning point was 1948, when the analysis of wear metals was introduced on the diesel engines of American railway locomotives. This moved the emphasis from the lubricant to the machine. The name “oil analysis” that got stuck on it still misleads to this day: many people do not grasp that what is at stake in the method is the availability of the machines.
The five routine tests
Section titled “The five routine tests”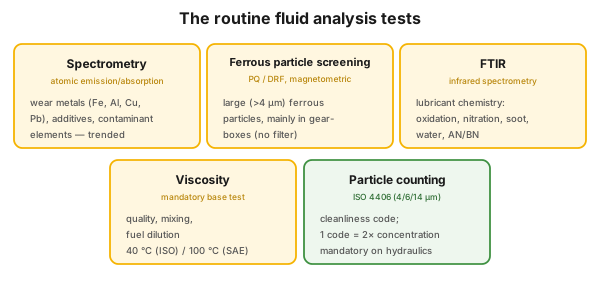 Figure 2 — the main tests and what they measure.
- Spectrometry (atomic emission/absorption): fast (about one minute), automatic analysis of the wear metals, additives and contaminants.
- Ferrous particle screening (PQ, DRF): two magnetometric methods, particle quantity measurement and direct-reading ferrography, for large (>4 µm) ferrous particles. Indispensable on a gearbox, where spectrometry already struggles.
- Viscosity: a mandatory base test for the quality of the lubricant and for detecting mixing or fuel dilution. Measured at 40 °C (ISO, industrial and rotating-machine lubricant) or at 100 °C (SAE, reciprocating machine and power transmission).
- FTIR (infrared spectrometry): the functional chemistry of the lubricant: oxidation, nitration, soot, water, AN/BN (ASTM E2412). Water is also detected by the crackle test (around 500 ppm) and by Karl Fischer titration (down to 10–20 ppm); fuel dilution is covered by gas chromatography (ASTM D3524).
- Particle counting (ISO 4406): a laser counter measures particles of 4–70 µm, and the classification is built on the 4, 6 and 14 µm classes. Every code number is twice the concentration of the one below it; filtration and the cleanliness target are built on this scale. It gives no elemental composition.
What do the metals in the sample tell you?
Section titled “What do the metals in the sample tell you?”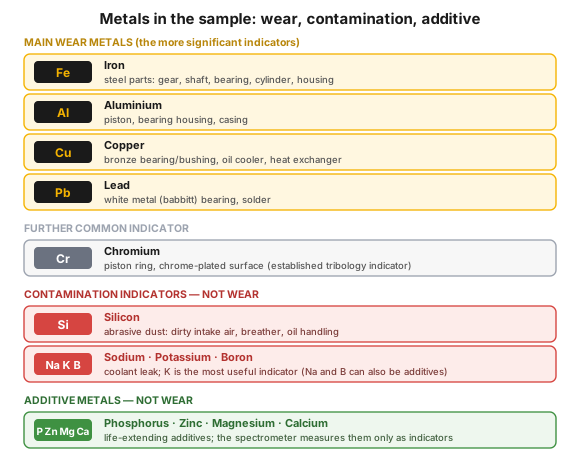 Figure 3 — the main wear metals, the contamination indicators and the additive metals.
Interpreting the wear metals requires knowing the metallurgy of the parts. The more significant indicators are iron (Fe), aluminium (Al), copper (Cu) and lead (Pb), with chromium (Cr) as a further common indicator. Silicon (Si) points not to wear but to ingested dust, while the combination of sodium, potassium and boron (Na, K, B) points to a coolant leak: among these K is the most useful indicator, because Na and B can also be additives. The additive metals (P, Zn, Mg, Ca) are measured by the spectrometer only as indicators. An element is flagged when it exceeds the limit value prescribed on the basis of the component type and the operating environment, and a trend is always prepared for it as well.
Which test for which component?
Section titled “Which test for which component?”The set of tests is decided by the type of the component.
| Component | Mandatory test | What to watch for |
|---|---|---|
| Diesel engine | metals, viscosity, water, soot, fuel | water indicates a cold-taken sample, glycol indicates a coolant leak |
| Hydraulics | particle counting (ISO 4406) | the precision clearances are sensitive to 4–14 µm |
| Gearbox | ferrous particle screening (PQ / DRF) | there is no filter, large particles are constantly present |
How does the process run, and what does the report contain?
Section titled “How does the process run, and what does the report contain?”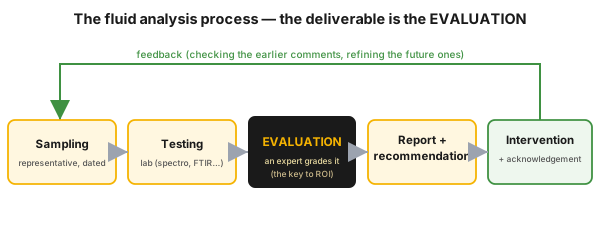 Figure 4 — from sampling through evaluation to intervention; the loop closes with feedback.
Five steps: sampling, testing, evaluation, report and recommendation, and finally intervention with feedback. The most essential is the evaluation: an expert grades the data, and the recommendation is born out of that. The benefit does not come by itself from the sampling, the maintenance has to be carried out as well, and close cooperation is needed between the analyst and the recipient.
The report brings five things:
- Quality data (bad data makes a bad recommendation).
- Flagging of the data according to the limit-value table and the alarm trend, with a colour code: white, green, yellow, orange, red.
- Expert comment and recommendation.
- Justification, so that the intervention is credible to the recipient.
- Urgency level: normal, abnormal, urgent or critical.
When is the sample valid?
Section titled “When is the sample valid?”- The machine should almost always be at operating temperature, or the sample should be taken within a short time after shutdown. This rule is what lies behind the “cold-taken sample”.
- Where possible, take the sample from the flow going toward the filter, at the same point, preferably through a dedicated sampling valve. On a gearbox, a hand vacuum pump or a port built in below the oil level is the practicable way.
- Record the lubricant hours and the date of sampling, and get the sample to the lab immediately.
Industrial and safety context
Section titled “Industrial and safety context”Fluid analysis is industry-independent: it can be applied equally to engines, gearboxes, hydraulics, compressors and turbines. On the timeline of failure development (the P–F curve), lube oil analysis and ferrography give a signal after vibration detection and before measurable heat generation, so they give a real but finite warning time. In a hazardous (Seveso) plant early recognition prevents a gearbox or compressor shutdown; the cleanliness of the hydraulic oil also protects the reliability of the control systems.
Introduction in practice
Section titled “Introduction in practice”The programme is decided before the first sample: fluid analysis is a cultural commitment, not a procurement item.
- Obtain leadership commitment and funding, and appoint a programme owner.
- Build an equipment database: component, manufacturer and model (this is where the metallurgy of the wear point comes from), the prescribed lubricant and the limit values.
- Derive the test plan from a reliability analysis (RCM, FMEA or PMO): for which component, with which test, at what frequency.
- Select the laboratory. The profile of a commercial lab is the most comprehensive (24–48 hour turnaround), but it is far away; the manufacturer’s lab is often inflexible; an on-site lab can be the best, but it needs enough samples and full-time operation.
- Ask about the evaluation before you sign: who grades it, and with what.
- Close the loop: the result of the intervention should feed back into the next evaluation.
Hands-on practice
Section titled “Hands-on practice”Pick three rotating machines (an engine, a hydraulic system, a gearbox). Write down for each which test is mandatory, how often you sample, from where, and who evaluates the result. The exercise has succeeded if it turns out where the wear would go unnoticed.
Common mistakes
Section titled “Common mistakes”- Treating it as “oil analysis”: looking only at the lubricant. Instead: let the wear-metal trend be the first line of the report.
- Skipping the evaluation: there is data, there is no grading, and there is no benefit either. Instead: the evaluation is the product ordered, not the raw data sheet.
- The wrong test for the component: on a gearbox, spectrometry without ferrous particle screening misses the large particles.
- Filtration without analysis. Instead: only oil qualified as filterable may be filtered, sampled before and after from the same point.
When NOT to use it (the limits of the method)
Section titled “When NOT to use it (the limits of the method)”Fluid analysis is a tool for wear and contamination, not universal machine diagnostics.
| Situation | Stronger tool | Why |
|---|---|---|
| After installation or overhaul: unbalance, shaft alignment | vibration analysis | a dynamic fault leaves no trace in the lubricant |
| A lube oil problem developing during operation | fluid analysis | the metals often appear before the vibration signal |
| There is nobody to evaluate the sample | organize the evaluation first | without it the sampling is a cost |
Take it home (keys)
Section titled “Take it home (keys)”- Read the report about the machine, not about the oil: the first question is the wear-metal trend.
- The circumstances of sampling are data in themselves: without a machine at operating temperature, the same point, the hours and the date, the trend is not a trend.
- Buy the evaluation, not the test: ask who grades the data, and with what.
- The second benefit finances the programme: qualifying the lubricant allows a longer oil change interval.
Self-test
Section titled “Self-test”- Water appears in the sample of a diesel engine, but there is no glycol. What is the most likely explanation?
- On a gearbox only spectrometry has been run for years, and every value is below the limit. Why is this not reassuring?
- An ISO 4406 code has risen by one step. How big a change is this in the concentration?
Answer key: 1) A cold-taken, invalid sample: a lubricant at operating temperature evaporates the water; repeat it on a machine at operating temperature. · 2) A gearbox has no filter, and large ferrous particles are hard for spectrometry to sense, so the wear can remain unnoticed. · 3) Twice: every code number is double the one below it.
How does this show up in digital practice?
Section titled “How does this show up in digital practice?”The sample–evaluation–intervention chain is also realized in software, and the measurement is getting ever closer to the machine.
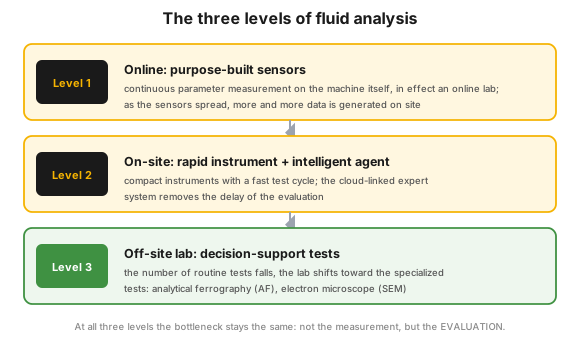 Figure 5 — the three levels of fluid analysis.
| Concept | Digital implementation | What it delivers |
|---|---|---|
| Routine measurement | online sensors on the machine (level 1) | continuous data, no sampling delay |
| Fast feedback | on-site rapid instrument with a cloud-based expert system (level 2) | the turnaround time disappears |
| Expert evaluation | intelligent agent: fewer errors, uniform wording | the recommendation speaks the language of the work order |
| Intervention | work order out of a condition alarm, asset condition dashboard | tracked work, more accurate evaluation |
Connection to OPEREX (shift log)
Section titled “Connection to OPEREX (shift log)”The circumstances of sampling (hours, date, point) and the actions assigned to the lab evaluation, recorded in the shift log (OPEREX), make the trend reliable. The round-walk observations (oil level, leakage, temperature) give the context of the result, so the loop closes auditably.
Terminology (HU / EN)
Section titled “Terminology (HU / EN)”| Hungarian | English (canonical) | Note |
|---|---|---|
| Olaj- / folyadékelemzés | Oil / Fluid analysis | Fa |
| Gép-állapotfelügyelet | Machine Condition Monitoring | MCM |
| Kopásfémek | Wear metals | Fe, Al, Cu, Pb |
| Vasrészecske-szűrés | Ferrous particle screening | PQ, DRF |
| Analitikai ferrográfia | Analytical ferrography | AF |
| Infravörös spektrometria | Fourier-Transform Infrared | FTIR |
| Részecske-tisztasági fokozat | Particle cleanliness code | ISO 4406 |
Why is oil analysis "about the machine" and not about the oil?
Because the wear metals appearing in the lubricant (Fe, Al, Cu, Pb) show the wear of the internal parts. The 1948 wear-metal analysis is what moved the emphasis from the lubricant to the machine.
What are the main tests?
Spectrometry (wear metals), ferrous particle screening PQ/DRF (on a gearbox), viscosity (at 40 or 100 °C), FTIR (oxidation, water, soot) and particle counting per ISO 4406 (on hydraulics).
What do iron, copper or lead in the sample indicate?
According to established tribological practice, iron points to a steel part, copper to a bronze bearing, and lead to a white metal (babbitt) bearing; the exact assignment comes from the metallurgy of the given machine. Silicon is not an indicator of wear but of ingested dust.
What is the most important phase of fluid analysis?
The evaluation: the expert grading of the data and the recommendation. This is the deliverable and the key to ROI; without it the practice has no benefit.
Related concepts
Section titled “Related concepts”asset condition management | vibration analysis | infrared thermography | preventive maintenance | reliability strategy | FMEA | criticality analysis | the bathtub curve
Next step
Section titled “Next step”Go on in this order:
- asset condition management — the complete condition monitoring toolkit.
- vibration analysis — the other primary technique, because of the division of labour.
- FMEA — this is where you derive which test is justified on which component.
References / further reading
Section titled “References / further reading”- ISO 4406 — coding of the contamination of hydraulic fluids (4 / 6 / 14 µm).
- ASTM E2412 — FTIR-based condition monitoring of in-service lubricants.
- ASTM D3524 — the gas chromatographic reference method for fuel dilution.
- ISO 17359 — the general framework of condition monitoring.
- ISO 3448 and SAE J300 — the background of the 40 °C and 100 °C viscosity references respectively.
- Reliabilityweb.com: Uptime Elements — the framework in which fluid analysis is the primary technique of asset condition management (ACM).