Maintenance planning and scheduling
≈ 12 min read · 2,432 words
If you change a tap at home and only notice mid-job that you do not have the right gasket, you spend half an afternoon driving around. The same thing happens in industrial maintenance, at the scale of whole shifts: the technician does not lose the time on the bolt, but on walking after the part and the permit.
Maintenance planning and scheduling raise the productivity of the maintenance workforce by removing waste from the work process.
Planning determines what the job needs and how it must be done: material, craft type and skill level, headcount, tools and permits, all gathered into one work plan package. Scheduling decides when and who does it. In a reactive environment (where more than 20% of the maintenance resource goes to unplanned work) productivity is below 30%; with effective planning and scheduling it can reach 60%, which essentially doubles the amount of work done with the same resource.
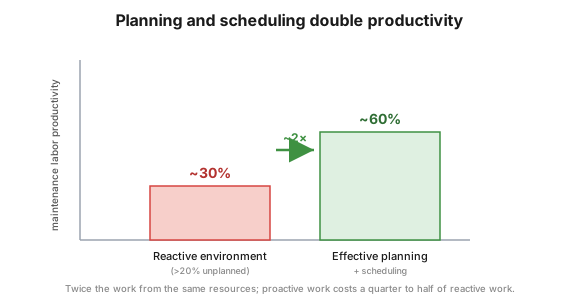 Figure 1 — planning and scheduling raise maintenance productivity from about 30% to about 60%.
Who is this for?
Section titled “Who is this for?”This article is for those responsible for preparing and assigning maintenance work and for the week’s schedule: maintenance manager · maintenance planner · scheduler · first-line maintenance supervisor · reliability engineer · plant and shift manager · warehouse and procurement lead.
Learning objectives
Section titled “Learning objectives”After completing this module you will be able to:
- separate planning from scheduling, and list the eight items of the work plan package
- set the planner ratio and the “does it need planning?” decision tree
- calculate your team’s weekly net capacity, and schedule against it
- measure the three key performance indicators
In brief
Section titled “In brief”- Planning = what and how (material, craft and skill level, headcount, tools, permits); scheduling = when and who.
- Proactive work costs a quarter to half of reactive work; productivity goes 30% → 60% (≈ twice the work).
- The planner ratio is 15–20 : 1 (technicians : planner); with a separate scheduler the planner can go to 30:1 and the scheduler to 60:1. A wrong ratio is the leading cause of planner programs failing.
- A decision tree says what has to be planned; the planner-scheduler function processes ≥ 80% of the work.
- Weekly scheduling is the most effective (daily is too shaky), and it must run on net capacity, not on nominal hours.
- Schedule ready work only; the supervisor spends ≥ 6 hours of the 8-hour shift with the crew.
- 3 KPIs: work distribution 20/40/40, planning compliance, schedule compliance.
What is maintenance planning and scheduling, and how do the two differ?
Section titled “What is maintenance planning and scheduling, and how do the two differ?”The two answer different questions: planning says what the job needs and how to do it, scheduling says when and who does it. Without planning there is nothing to schedule; without scheduling even the best work plan stays in the drawer.
It is the planner’s job description that a complete work plan package exists for every non-emergency work order. This is exactly what limits how many work orders they can process, and it is why the planner ratio matters so much.
Why is it worth it?
Section titled “Why is it worth it?”The savings show up in three areas: maintenance labor, materials and contractors. On the labor side productivity grows from about 30% to about 60%. On the materials side, forecasting demand brings better supplier prices, optimal stock levels, less loss from expired shelf life, just-in-time supply and kitting. Contractor cost falls through more efficient allocation of resources.
Does the work need planning at all?
Section titled “Does the work need planning at all?”Not all of it: every organization sets its own criteria, which is why the process starts with a decision tree or flowchart.
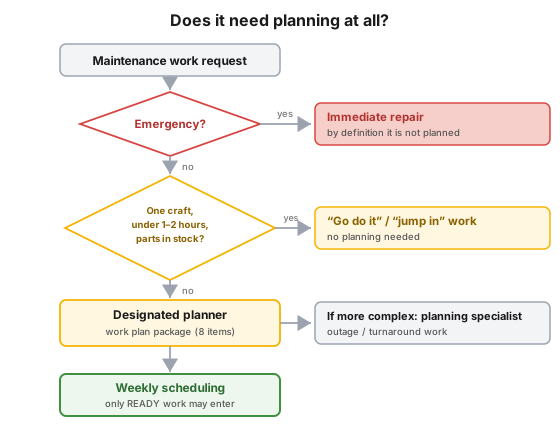 Figure 2 — the entry decision tree, from the work request to the weekly schedule.
Small “go do it” / “jump in” jobs (tasks requiring one technician skill, that is a single craft, taking less than 1–2 hours, with the part in stock) do not need planning. Whatever meets the minimum criteria goes to the designated planner; more complex work (outage, turnaround) goes to a planning specialist.
The eight items of the work plan package
Section titled “The eight items of the work plan package”Examining the job, the planner determines eight items:
- all the required material;
- the specified craft type and skill level;
- the required number of craft technicians;
- a list of all required tools;
- a list of all non-standard equipment;
- a detailed description of every step of the job;
- a list of all safety requirements;
- all applicable regulatory (occupational and environmental) requirements and permits.
The planner ratio
Section titled “The planner ratio”The planner’s workload is better estimated not from the number of work orders planned per day (jobs differ in complexity) but from the number of technicians served. A good technician : planner ratio is 15 : 1 – 20 : 1 if the same person both plans and schedules. A higher ratio damages the effectiveness of the program; with fewer than 15 technicians, on the other hand, the planner is probably not properly employed. With separate positions the ratio can go up to 30:1 for planning and 60:1 for scheduling. If the ratio is not kept within reasonable bounds, quality suffers: in industry this has been the root cause of the great majority of failed planner programs.
Scheduling
Section titled “Scheduling”The finished plan goes into scheduling. The first-line maintenance supervisor is accountable for the job being done according to the planner’s work plan: the planner specifies the craft and skill level, and the supervisor names the actual technician(s). For that, the supervisor has to spend at least 6 hours of the 8-hour shift on site with the crew (at most 2 hours on administration), otherwise there is no adequate control.
Weekly scheduling is the most effective. Daily scheduling is too shaky: if it is set 16 hours after the start, one breakdown in between upsets it. The weekly rhythm gives flexibility (it leaves room for emergencies) while providing enough control against wasted resources; emergency work, interruptions and PM can be averaged out on a weekly basis.
Net-capacity scheduling
Section titled “Net-capacity scheduling”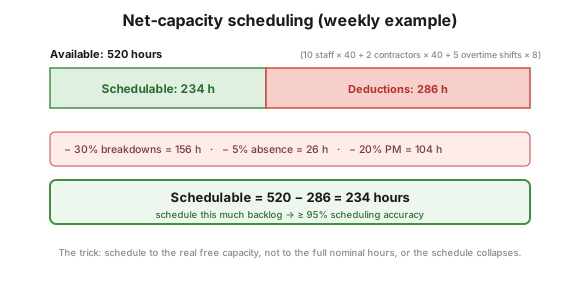 Figure 3 — subtracting the expected interruptions from the total nominal hours gives the capacity that can actually be scheduled.
The trick is to schedule against the free capacity, not against the full nominal hours. Example: 520 hours (10 staff × 40 + 2 contractors × 40 + 5 overtime shifts × 8); deductions: 30% breakdowns (156), 5% absence (26), 20% PM (104) = 286 hours; schedulable = 520 − 286 = 234 hours. Scheduling that much backlog work makes ≥ 95% scheduling accuracy achievable.
The weekly scheduling cycle
Section titled “The weekly scheduling cycle”The cycle has six steps and runs a week ahead: the planner closes the backlog at the end of the week, and hands the next week’s schedule to the supervisor on Friday.
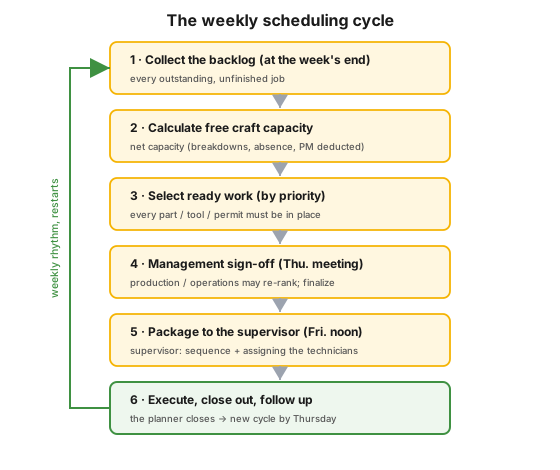 Figure 4 — the weekly cycle from the backlog through execution to close-out, then it restarts.
- Collect the backlog at the end of the week (every unfinished job waiting to be done).
- Calculate the free craft capacity for the following week (net capacity).
- Select the ready jobs from the backlog by priority / required-by date / equipment availability, up to the limit of the capacity; the planner may also add further jobs in an optional category, in case reactive work turns out to be lower than expected, or a change in the production schedule limits which equipment can be taken out of service.
- Management sign-off: on the Thursday before the start, the maintenance manager aligns with the production and operations leaders (re-ranking, finalization).
- The planner hands a package (work orders, picking list, permits) to the supervisor at noon on Friday; the supervisor sets the sequence and names the technicians.
- Execution, close-out, follow-up: by Thursday the planner is ready for the next cycle.
Key performance indicators
Section titled “Key performance indicators”Three metrics steer the process: the composition of the work, and the accuracy of planning and of scheduling.
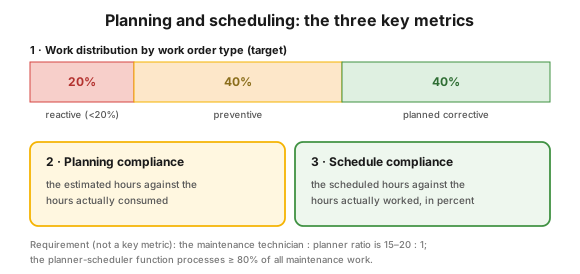 Figure 5 — the three key metrics, with the coverage and ratio requirement below them.
- Work distribution by work order type: the hours spent on a given work type as a percentage of all work hours; the target is 20/40/40, that is reactive < 20%, preventive ~40%, planned corrective ~40%.
- Planning compliance: the estimated hours against the hours actually consumed. With integrated (maintenance + operations) scheduling, inaccuracy in the maintenance schedule feeds straight through to the production schedule. The manager can drill down to the work orders causing the deviation; if the cause is not the planning process, the investigation points to another problem worth fixing.
- Schedule compliance: the scheduled hours against the hours actually worked, in percent. Work order counts may also be used, but only alongside the itemized hours, because only from those can the real cause of the deviations be determined.
When NOT to use it? (the limits of the method)
Section titled “When NOT to use it? (the limits of the method)”There is work on which planning is pure waste, and there are numbers that must not be adopted as a recipe.
- On emergency work. By definition it is not planned; the breakdown deduction in the weekly schedule leaves room for it.
- On small “go do it” work. One craft, shorter than 1–2 hours, part in stock: here planning is administrative waste.
- On a daily or other cycle. The daily rhythm is not reliable, and the other schedules are either uncontrolled or too constrained.
- Taking the staffing ratios as a recipe. The 15–20 : 1, the 30:1 and the 60:1 are a general starting point, to be adjusted to organizational and geographic circumstances.
- As a single template. With several planners the schedules and the crafts have to be aligned, and area maintenance may differ from central maintenance.
Common mistakes
Section titled “Common mistakes”This is how you recognize that you have no real planning and scheduling: 50–70% of the work is not in the weekly schedule, there is no schedule compliance measurement, the crews are scheduled to less than 75% of the weekly hour budget, and “we fix it when it breaks” thinking prevails.
- Wrong planner ratio: too many technicians per planner → declining quality → program failure.
- Daily scheduling: too shaky, one breakdown in between upsets it.
- Scheduling work that is not ready: a missing part or permit = lost production and wasted resources.
- Scheduling on full nominal hours: without the deductions the schedule is unrealistic.
- The supervisor stuck in administration: without ≥6 hours with the crew there is no control.
- No decision tree: everything gets “planned”, even the small go-do-it tasks.
Industrial and safety context
Section titled “Industrial and safety context”Planning and scheduling are industry-independent. In the process industry, planning also serves safety: the work plan package contains the work permits, the protective equipment and the safety requirements, so the crew starts only after passing the “is the job ready” gate. Good planning is at the same time a driver of wrench time: less searching and less waiting. In a hazardous (Seveso) plant, unplanned “schedule-breaker” work is not only expensive but also riskier.
Putting it into practice
Section titled “Putting it into practice”The order matters: first the gates, then the weekly rhythm, finally the measurement.
- Set the planner ratio (15–20:1) and the decision tree; the coverage requirement is that the function processes ≥ 80% of the maintenance work.
- Plan a complete package (the eight items), schedule in a weekly cycle and against net capacity, then measure the three key metrics.
Take it home (keys)
Section titled “Take it home (keys)”- Separate the two questions. First the work plan package (what is needed), then the schedule (when and who).
- Draw the gate first. A decision tree is worth more than a perfect template that lands on every small job.
- The planner ratio is an organizational decision. Most failed planner programs failed here; below 15 technicians, though, look into what else the planner is doing.
- Schedule against net capacity. Nominal hours are a promise, not capacity.
- If you do not measure schedule compliance, you do not have a schedule. Counts without hours will not show you where the week comes apart.
Connection to OPEREX (shift log)
Section titled “Connection to OPEREX (shift log)”“Schedule-breaker” (reactive) work and emergency interruptions, and the deductions from net capacity, are measurable from the shift log (OPEREX), so the following week’s schedule stays realistic. The “is the job ready” status can be recorded in the shift handover.
Terminology (HU / EN)
Section titled “Terminology (HU / EN)”| Hungarian | English (canonical) | Note |
|---|---|---|
| Tervezés | Planning | what and how |
| Ütemezés | Scheduling | when and who |
| Tervező / ütemező | Planner / scheduler | what-how / when-who |
| Elmaradt munka | Backlog | unfinished jobs |
| Ütemtörő munka | Schedule-breaker | unplanned reactive work |
| Nettó kapacitás | Net capacity | free, schedulable hours |
| Tervezési megfelelés | Planning compliance | estimated vs. consumed hours |
| Ütemezés megfelelősége | Schedule compliance | scheduled vs. worked hours |
| Értékteremtő idő | Wrench time | pure hands-on working time |
The terminology follows the usage of Uptime Elements.
What is the difference between planning and scheduling?
Planning determines what the job needs and how it must be done (material, craft, skill level, headcount, tools, permits); scheduling determines when and who does it.
Why weekly and not daily scheduling?
Daily scheduling is too shaky, one breakdown in between upsets it. The weekly rhythm gives flexibility for emergencies, and provides enough control against wasted resources.
What does net-capacity scheduling mean?
That we subtract the expected interruptions (breakdowns, absence, PM) from the nominal hours, and schedule only against the remaining free capacity. In the example 520 − 286 = 234 hours.
Self-test
Section titled “Self-test”Self-check questions
- In a 30-strong technician crew, how many planners are needed if the same person plans and schedules?
- The weekly schedule showed 180 estimated hours, and the jobs took 240 hours. Which metric got worse, and what do you examine first?
- A belt change needs one craft, is done in 40 minutes, and the part is in stock. Do you plan it?
Answer key: 1) Two: in the 15–20 : 1 band, 30 technicians require two planners. · 2) Planning compliance; you drill down to the work orders causing the deviation, and if the cause is not the planning process, you find another problem worth fixing. · 3) No: this is “go do it” work.
Applied exercise
- Calculate your team’s net capacity for next week: subtract breakdowns, absence and PM from the nominal hours, then see how many backlog hours fit inside.
Related concepts
Section titled “Related concepts”preventive maintenance | CMMS | wrench time | reliability strategy | operator-driven reliability | criticality analysis | reliability KPIs
References / further reading
Section titled “References / further reading”- Uptime Elements reliability framework, © NetexpressUSA Inc. d/b/a Reliabilityweb.com: the “planning and scheduling” element.
- Terry Wireman: Maintenance Strategy Series, and Zero Breakdown Strategies (2012). Reliabilityweb.com, Fort Myers.