Infrared thermography
≈ 11 min read · 2,294 words
Thermal cameras have become cheap and rugged, so they end up in a lot of hands: the image is ready in seconds, and the coloured blob convinces everyone. That is exactly the trap: the image is deceptively simple, the physics behind it is not.
Infrared thermography is a condition-based (CBM) technique: the camera images the object’s infrared radiation and computes temperature from it.
The camera therefore does not measure temperature: the energy it sees contains emitted, reflected and transmitted radiation alike, so to arrive at a temperature you have to know the surface’s emissivity (ε = 0–1). The fault signal can be a hot spot, a cold spot or an uneven temperature distribution, in electrical, mechanical, process and building inspections alike.
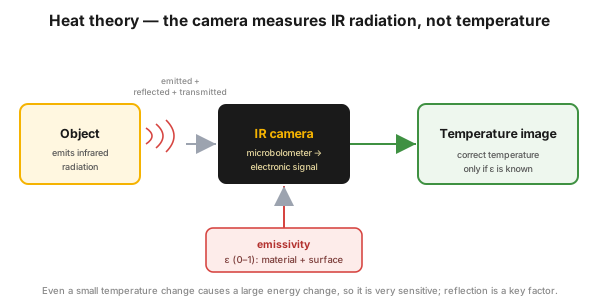 Figure 1 — the camera measures IR radiation; the temperature requires the emissivity (ε).
Who is this for?
Section titled “Who is this for?”This article is for those who look at thermal images, order them, or make decisions from them: maintenance technician and electrician · reliability engineer · asset condition manager · process engineer · plant and shift supervisor · HSE.
Learning objectives
Section titled “Learning objectives”After reading this article you will be able to:
- explain why the camera measures radiation, and what the emissivity is needed for;
- recognize the three signal types: hot spot, cold spot, uneven distribution;
- distinguish a survey from a thermography program;
- say when the IR inspection is not the right tool.
The essence
Section titled “The essence”- The thermal camera measures IR radiation, not temperature; the temperature needs the emissivity (ε, 0–1).
- The energy it sees = emitted + reflected + transmitted, which is why reflection is a key factor; even a small temperature change is a large energy change.
- Three signals give the fault away: hot spot, cold spot, uneven temperature distribution.
- Versatile: electrical (switchgear above all), mechanical, process, building.
- Survey ≠ program: a program is a trended image series taken from the same distance and angle.
Why it matters (the stakes)
Section titled “Why it matters (the stakes)”An unrecognized hot spot in the switchgear leads to fire and a forced shutdown, when spotting it would have been a few minutes of measurement. Because of the cost and the risk of failures, for most thermography programs the price of the instruments and the training pays for itself at the very first failure detected.
Yet many organizations stop at the switchgear, because that is what the insurer asks for; where the workers themselves may use the camera, they regularly find new, value-creating applications.
What is infrared thermography, and why does it measure radiation?
Section titled “What is infrared thermography, and why does it measure radiation?”Infrared thermography images the thermal radiation of a surface and translates that into temperature. The camera measures radiation because that is the only thing directly detectable: every object emits infrared radiation, and the amount grows with temperature.
The emissivity is determined by the material and the condition of the surface. Since the energy seen also contains the reflected and the transmitted radiation, reflection is critical: a shiny surface can fool you. The detector (a microbolometer or a photon detector) converts the radiation into an electronic pulse and then into a video image, where the colours show the differing emitted energy.
The parameters to set for an accurate temperature
Section titled “The parameters to set for an accurate temperature”For fault detection it is enough to set the focus, the temperature range and the brightness; for the correct temperature value five further parameters are needed.
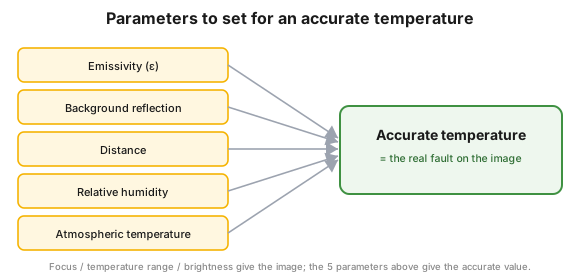 Figure 2 — for detection the focus / range / brightness is enough; the accurate temperature needs five parameters.
These are: the emissivity (ε), the background reflection, the distance, the relative humidity and the atmospheric temperature. Without them the value can be wrong; the real fault is shown by the correct settings and a trained thermal-image analyst.
Where can it be used?
Section titled “Where can it be used?”Thermography is industry-independent: it works everywhere a fault causes a surface temperature difference. It has four large areas.
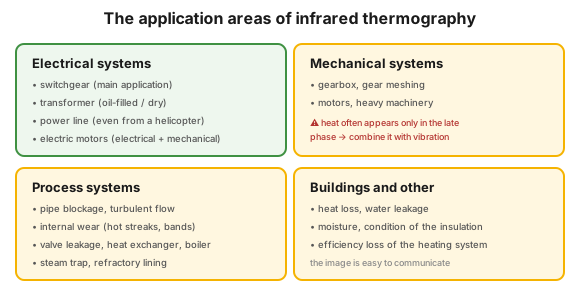 Figure 3 — the main application areas.
- Electrical systems: the switchgear is the main application (its fault patterns are below); transformers, of which the insurer often asks for an annual, “known good” image; power lines (earth fault, broken strands, spiral heating, loose connection; on an inaccessible section with a helicopter-borne, stabilized camera); electric motors, where electrical and mechanical faults show up alike (unbalanced load, winding, rotor and bearing faults, misalignment).
- Mechanical systems: gearbox and gear-meshing faults, backlash, lubrication problems, overload, motors and heavy machinery (overheated tyres and brakes, blocked cooling).
- Process systems: pipe blockage, turbulent flow, internal wear (hot streaks, bands, wear points), valve leakage, heat exchanger and steam trap troubles, boiler faults, refractory lining or insulation damage.
- Buildings and other: heat loss, water leakage, moisture, the condition of the insulation, the efficiency loss of the heating system; beyond these, security applications.
What does the thermal image tell you? (signal → likely cause)
Section titled “What does the thermal image tell you? (signal → likely cause)”The thermal image on its own is not a diagnosis: the type and the location of the signal point to the cause. The most typical electrical patterns:
| Signal on the thermal image | Likely cause |
|---|---|
| Bushing hot spot at the top / at the bottom | bad connector / internal problem |
| Uniformly warm bushing | bad bushing |
| Uneven distribution in the transformer cooler | low oil level, blocked circulation |
| Exceptionally hot spot on a dry transformer | short circuit |
| Uneven winding temperature / hot spot | one-sided load / turn-to-turn short |
| Cold spot in the switchgear | faulty winding |
| Uneven heating at the fuse | faulty fuse or holder |
Survey or program?
Section titled “Survey or program?”A survey is a one-off, ad-hoc inspection; a program is a defined process, with saved and trended images. Surveys are not programs, and the difference comes out on the day of the loss event.
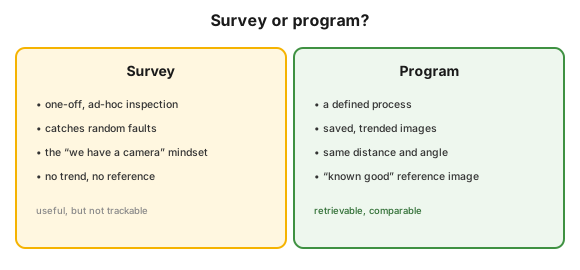 Figure 4 — the one-off survey and the systematic program are not the same thing.
Insurers often ask whether you have a thermography program, and most camera owners answer yes. After an incident, however, they ask for the image of the failed component in known good condition, and that image only exists if the recordings were kept.
The report
Section titled “The report”As with every CBM technique, thermal images need a clear, concise report too. It should contain:
- a visible-light photo, so that the intervention is aimed at the right place;
- the temperature of the object and its surroundings, together with the process load at the time;
- the thermographer’s observations and recommendations;
- the value of the finding, the cost avoided (“if we had not found it, then…”).
Industrial and safety context
Section titled “Industrial and safety context”The Hungarian industrial name of the technique is termovízió (thermal imaging), and its value proposition is one sentence: it gives an assessable picture of the condition of equipment while the plant is running, with a non-destructive inspection, from a safe distance.
Safety: in electrical inspections the risk of injury is extremely high, so the electrical standard and every precaution are mandatory: arc-flash personal protective equipment and an inspection window, so that a live enclosure need not be opened. In a hazardous (Seveso) plant the early recognition of a hot spot prevents fire and a forced shutdown, while the “known good” reference images also serve the insurer’s expectation.
Putting it into practice
Section titled “Putting it into practice”Build a program, not a survey: this is the order that carries the camera over into systematic practice.
- Set the scope on the basis of the critical assets (criticality analysis).
- Fix the recording rule: the same route, distance and angle, with the load and the ambient temperature noted.
- Take “known good” reference images of the designated components, in a fault-free state.
- Set the parameters (ε, reflection, distance, humidity, atmospheric temperature) if you also report a value.
- Train the thermographer: the recognition training decides whether the image shows the fault.
- Combine it with another CBM technique: vibration for an early mechanical fault, oil analysis for wear.
- Report value: photo, temperature, load, recommendation, cost avoided.
Hands-on
Section titled “Hands-on”A motor control centre (MCC) room is the best pilot. Photograph every cabinet from the same distance and angle, note the load and the ambient temperature, and take a visible-light photo pair for every thermal image. Archive the series as a “known good” reference, and repeat it three months later. If the two can be compared, you have a program.
Common mistakes
Section titled “Common mistakes”- “A survey called a program”, without a trend. Instead: a fixed route, the same distance and angle, a saved image series.
- Ignoring emissivity and reflection: a wrong value, and the shiny surface fools you. Instead: set the parameters for every numerical finding.
- The “every fault is hot” assumption. Instead: the cold spot and the uneven heating are fault signals just the same.
- Dropping the safety precautions in an electrical inspection, with an arc-flash risk.
When NOT to use it (the limits of the method)
Section titled “When NOT to use it (the limits of the method)”Infrared inspection is the wrong tool if it is not the surface temperature that gives the fault away.
- It does not measure the temperature of gases and liquids: the instrument sees the surface, not the inside of the medium.
- It requires a clean environment: with dust and high humidity the measurement is unreliable.
- It is late in the early phase of a mechanical fault: there vibration analysis and oil analysis are the right choice.
- Specialty instruments can be expensive, so match the scope to the critical assets.
Take it home (keys)
Section titled “Take it home (keys)”- Do not stop at the switchgear: thermal imaging is useful elsewhere too.
- Use the insurance angle: the technique satisfies many insurer requirements.
- Pair the thermal image with a digital photo: the compared image pair shows the location of the fault.
- An IR finding opens a gate: the fault found leads on to further inspection techniques.
- Surveys are not programs: images taken in a known good condition and recognition training are needed.
Self-test
Section titled “Self-test”- What does the camera see, and what is needed to turn that into a correct temperature?
- A cold spot shows on the thermal image of a switchgear. What do you suspect?
- You photograph the whole plant every six months. What is missing for this to be a program?
Answer key: 1) IR radiation (emitted + reflected + transmitted); the temperature needs ε, background reflection, distance, humidity and atmospheric temperature. · 2) A faulty winding. · 3) A defined process: images saved and trended from the same distance and angle, plus a “known good” reference image.
How does this show up in digital practice?
Section titled “How does this show up in digital practice?”The value of a thermal image lies not in the shot but in the comparison, and the same logic is realized in software too.
| Thermography element | Digital implementation | What it delivers |
|---|---|---|
| Thermal image, measurement data | a condition record tied to the asset register | the image lives at the asset |
| Post-processing | analysis software: colour palette and range, infrared–visible blending, isothermal bands | the signal separates from the background |
| Several techniques together | thermography, vibration, oil condition and process flow compared on one surface | the fault picture is reinforced |
| Trend, alarm | threshold-based alarm, asset condition dashboard | the deviation signals by itself |
| Intervention | an automatic work order from the finding | the finding does not stay in the report |
Connection to OPEREX (shift log)
Section titled “Connection to OPEREX (shift log)”Thermal findings (hot spot, switchgear or bearing overheating) and the actions assigned to them can be recorded in the shift log (OPEREX), together with the visible-light reference photo, the inspection load and the ambient temperature, so the context of the image is preserved. The “hot, smelly, noisy” observations of the operator round give an early signal, and a worsening trend can be escalated.
Terminology (HU / EN)
Section titled “Terminology (HU / EN)”| Hungarian | English (canonical) | Note |
|---|---|---|
| Infravörös termográfia | Infrared thermography | CBM technique |
| Termovízió | Thermal imaging | Hungarian industrial synonym |
| Kisugárzási együttható | Emissivity | ε, 0–1 |
| Forró pont / hideg pont | Hot spot / cold spot | the two basic signals |
| Kapcsolóberendezés | Switchgear | main electrical application |
| Kondenzedény | Steam trap | process application |
| Ívkisülés elleni védelem | Arc-flash protection | safety |
| Felmérés / program | Survey / program | one-off vs systematic |
What does the thermal camera actually measure, and what is emissivity?
It measures infrared radiation, not temperature. The energy it sees also contains the reflected and the transmitted radiation, which is why the temperature needs the emissivity: a value between 0 and 1, determined by the material and the condition of the surface.
Does every fault show up as a hot spot?
No. The signal can be a hot spot (bad connection), a cold spot (faulty winding) or an uneven temperature distribution (faulty fuse, transformer cooler with a low oil level, one-sidedly loaded winding).
What is IR thermography not suitable for?
It is not for measuring the temperature of gases and liquids, it is unreliable in a dusty or humid environment, and it is late in the early phase of mechanical faults. That is where vibration analysis belongs.
What is the difference between a survey and a program?
A survey is a one-off, ad-hoc inspection; a program is a defined process: the images are taken from the same distance and angle, they are saved for trending, and there is a “known good” reference image as well.
Related concepts
Section titled “Related concepts”asset condition management | vibration analysis | oil analysis | preventive maintenance | reliability strategy | FMEA | criticality analysis
Next step
Section titled “Next step”From here it is worth going on, in this order:
- asset condition management — where IR sits on the PdM palette.
- vibration analysis — the early signal of rotating-machine faults that IR does not give you.
- reliability strategy — when to choose the condition-based tactic.
References / further reading
Section titled “References / further reading”- Reliabilityweb.com — Uptime Elements (Asset Condition Management): a public reliability framework that classes infrared thermography among the condition monitoring techniques.
- Eduardo Calixto: Gas and Oil Reliability Engineering (Elsevier, 2016): the advantages and the limits of infrared inspection.