The three financial statements
≈ 18 min read · 3,553 words
Whether you earned well this month and whether there is money in your account on the 15th, when the loan instalment goes out, are two completely different questions. For a company it is the same: profit and cash are not the same thing. That is why three tables are drawn up for every business: how much it earned over a period, what it owns on a given day, and where the money went in the meantime. Let’s look at what the financial statements mean, on which examples their difference shows, and how they connect.
The three financial statements are the income statement, the balance sheet and the cash flow statement, giving a company’s full financial picture. The income statement (profit and loss, P&L) shows the result of a period, like a movie; the balance sheet records the financial position at a single point in time, like a snapshot; and the cash flow statement bridges the two by explaining the actual change in cash. All three describe the same economic events from three views, which is why even a profitable company can end up unable to pay.
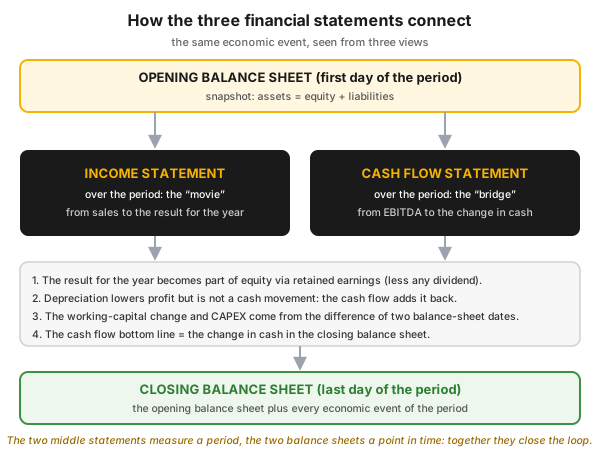
Figure 1 — the relationship map of the three statements: two points in time, one period, and the four links between them.
Who is this for?
Section titled “Who is this for?”For those who decide about money without being finance people: plant manager · shift supervisor · process engineer · maintenance manager · project manager · investment engineer · Lean/CI coordinator · team leader who writes a business case.
Learning objectives
Section titled “Learning objectives”After reading this article you will be able to:
- say which number to look for in which table;
- read the staircase and margin ratios of the income statement;
- derive why profit does not equal cash;
- show the four links between the three statements;
- calculate, in working capital, what a cut in inventory is worth.
In brief
Section titled “In brief”- Three tables, three views: a period, a point in time, and the bridge between them.
- The balance sheet is always in balance: assets = equity + liabilities.
- Because of the accrual basis, revenue arises on performance, not when the money comes in.
- Working capital is where operations and cash meet: receivables + inventory − payables.
Why isn’t looking at profit enough? (the stakes)
Section titled “Why isn’t looking at profit enough? (the stakes)”Because profit is an accounting result, paying requires cash, and the two do not arise at the same time.
What are the three financial statements?
Section titled “What are the three financial statements?”The three tables together form one set; on their own each is incomplete.
| Statement | What it shows | Nature | Bottom line or key equation |
|---|---|---|---|
| Income statement (P&L) | how sales turn into the result for the year | period (“movie”) | sales − expenses = result for the year |
| Balance sheet | what the company has, and how it funds it | point in time (“snapshot”) | assets = equity + liabilities |
| Cash flow statement | the inflow and outflow of cash | period (“bridge”) | cash in − cash out = change in cash |
The report under the standard is wider: it also includes the statement of changes in equity and the notes (which reveal by what method the figures were prepared). Inside, management reads it; outside, the investor, the bank, the tax authority and the public do. The differences of the internal report are covered by financial vs. management reporting. In a group the parent prepares a consolidated report, and the figures are certified by an independent auditor.
What does the income statement show?
Section titled “What does the income statement show?”It shows how sales become a profit or a loss: at each level we deduct one type of cost, and the remainder gets a name.
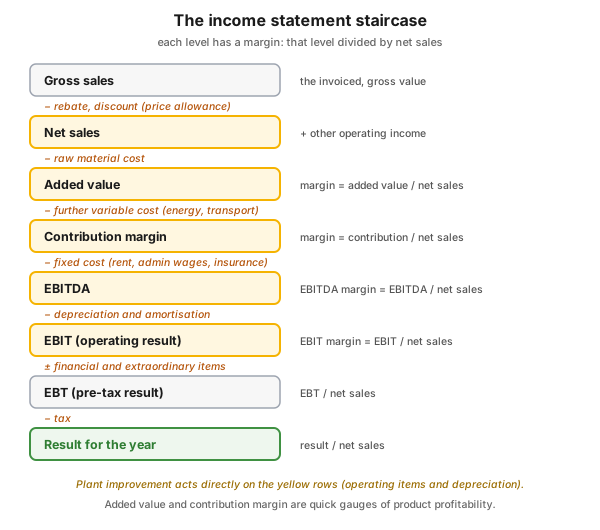
Figure 2 — the income statement staircase from gross sales to the result for the year.
Deducting the price allowances (discount: a percentage price reduction; rebate: a reduction tied to conditions) gives net sales. From here, two measures: added value (net sales minus raw material cost) measures how much the company itself adds to the product, and the contribution margin (net sales minus variable cost) measures what the fixed cost must be covered from. Contribution margin is the gauge of product-level profitability, and from it the break-even point derives.
Fixed cost is payable even at zero production; variable cost moves in proportion to activity; the breakdowns are detailed in cost structure and contribution.
EBITDA (earnings before interest, tax, depreciation and amortisation) is useful for comparison across industries; EBIT (operating result) is the basis of the return-on-capital ratios; then comes EBT, and finally, after tax, the result for the year.
What does the balance sheet show?
Section titled “What does the balance sheet show?”The financial position on a single reporting date: what the company has, and how it funds it.
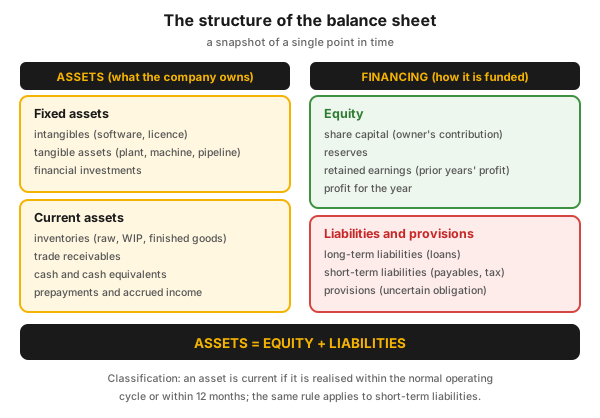
Figure 3 — the two-column structure of the balance sheet and the accounting equation.
The two sides are always equal: assets = equity + liabilities. According to the conceptual framework, an asset is a controlled resource from which future benefit is expected; a liability is a present obligation whose settlement involves an outflow of resources; equity is the residual. An item enters the balance sheet if it meets the definition, the cash movement is probable, and the value is measurable. A current asset is one that is realised within the operating cycle or within 12 months.
What does the cash flow statement show?
Section titled “What does the cash flow statement show?”The actual inflow and outflow of cash over a period.
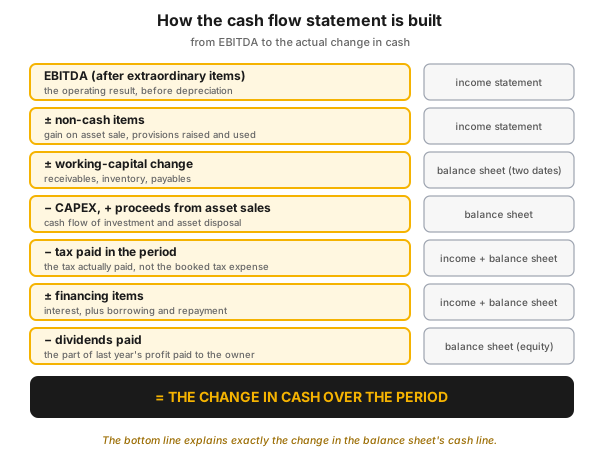
Figure 4 — how the cash flow is built step by step, with the source of each row marked.
The derivation starts from EBITDA (after the extraordinary items) and corrects step by step:
- Non-cash items: the result of an asset sale (sale price minus net book value) and the raising of provisions. On the use of a provision it is the reverse: cash goes out, no expense arises.
- Working-capital change: growing sales and a later-paying customer have a negative effect on cash flow.
- Investment: CAPEX is a cash outflow, an asset sale a cash inflow.
- Tax paid, financing items (interest, borrowing and repayment), and finally the dividend paid.
The standard asks for it split into three activities: operating, investing and financing cash flow. A commonly used approximation of operating cash flow (not the full statement-standard derivation): net profit + depreciation − increase in inventory − increase in receivables + increase in payables. If this consistently exceeds the profit, the profit is of “good quality”.
How do the income statement, the balance sheet and the cash flow statement connect?
Section titled “How do the income statement, the balance sheet and the cash flow statement connect?”They are tied together by four concrete links.
1. The profit flows into equity. The result of the period becomes part of equity through retained earnings, reduced by the part paid out as dividend.
2. Depreciation behaves differently in three places. In the income statement it is an expense, in the balance sheet it reduces the net book value (acquisition value minus accumulated depreciation), and in the cash flow it must be added back. CAPEX is the reverse: it appears in the balance sheet and the cash flow, but in the result only from capitalisation onward, spread over the useful life, after deducting the residual value. The straight-line method charges the same share to every year (2% a year for a building planned for fifty years); the declining-balance method charges more to the early years.
3. The cash flow can be produced from the other two. EBITDA and interest come from the income statement, CAPEX and the working-capital change from the difference of two balance-sheet dates.
4. The bottom line closes the loop. The end of the cash flow is exactly the change in the balance sheet’s cash line; if it does not agree, one of the tables is wrong.
Why are profit and cash not the same?
Section titled “Why are profit and cash not the same?”Because accounting follows not the cash movement but the performance. Three principles fix this.
- Accrual basis. Revenue is recognised on performance (service done, goods delivered), and expense when the obligation arises: if the shipment happens on 30 December but the invoice arrives in January, the revenue is December’s.
- Matching. To a period’s revenues the expenses belonging to them must be assigned: production cost first enters inventory, and only on sale enters the result.
- Prudence. Revenue is booked only when collection is reasonably certain, expense immediately, as soon as the cost becomes probable. Hence the accruals and the provisions.
Where do the three statements meet operations?
Section titled “Where do the three statements meet operations?”In working capital: this is where the daily operating decisions (inventory level, invoicing speed, supplier payment) become a measurable financial impact.
Working capital = receivables + inventory − payables.
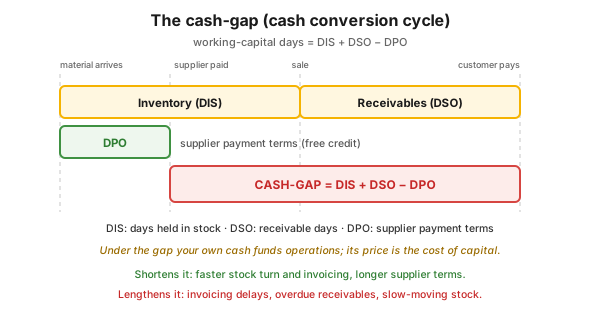
Figure 5 — the cash-gap: the sum of inventory and receivable days minus the supplier payment terms.
Measured in time this is the cash-gap (cash conversion cycle), split by three day-metrics: DSO (collection time), DIS (days in stock) and DPO (supplier payment time). Two kinds of credit sit in the cycle: the agreed (contractual payment terms) and the hidden (a late-paying customer, slipping invoicing, too high a safety stock); you finance both, yet the cost of it does not show in the income statement. The day-metric formulas, the Days Working Capital aggregate and the shortening of the cycle are carried through by working capital and the cash conversion cycle.
What does this mean in the process industry?
Section titled “What does this mean in the process industry?”The process industry is capital-intensive: a large asset base, long lifetimes, fluctuating product prices. The weight of a few accounting items is therefore greater.
| Area | Typical accounting treatment |
|---|---|
| Useful life | differs by asset group: a processing and chemical plant 4–12, a building 10–50, a gas and oil store 7–50 years; land is not depreciated |
| Turnaround | part of the major overhaul may be capitalised where the standard and the recognition criteria are met, the rest is a period cost (in oil & gas it is typically capitalised) |
| Line fill, cushion gas | the minimum charge needed for normal operation, typically capitalised as a tangible asset in oil & gas (the classification is standard- and company-specific) |
| Impairment | if the expected cash flow falls durably below the book value, an impairment must be recognised |
| Decommissioning obligation | a provision must be raised for the cost of dismantling and environmental restoration |
Two consequences: depreciation here has real economic substance (the asset wears out and must be replaced), so EBITDA — which leaves exactly this out — should be read with care in a capital-intensive plant; and safety and environmental investments are not ranked by their return.
How is a plant improvement translated into financial impact?
Section titled “How is a plant improvement translated into financial impact?”By finding which line it moves: in the income statement the operating lines and depreciation, in the balance sheet the assets and the short-term liabilities. An inventory reduction, for example, acts through three channels: the financing cost of the tied-up capital falls, a one-off cash inflow arises from selling the surplus, and asset turnover improves. The full path and a worked example are carried through by financial vs. management reporting; in Lean terms the same thing is the shortening of the timeline (vsm, pull system).
What do you see of this in the management report?
Section titled “What do you see of this in the management report?”The management report’s indicators are ratios of the lines of the three tables, in four families: the numerator and the denominator show which operating decision moves them.
| Family | Indicator | Formula | From where |
|---|---|---|---|
| Liquidity | current ratio, quick ratio | current assets (excl. inventory) / short-term liabilities | balance sheet |
| Profitability | contribution and EBITDA margin | contribution, or EBITDA / net sales | income statement |
| Profitability | ROOC, ROCE | EBIT / operating capital, or / capital employed | both |
| Activity | asset turnover, inventory turnover | sales / capital employed; COGS / inventory | both |
Thresholds: by the traditional rule of thumb a current ratio around or above 2 is considered safe and below 1 signals a liquidity problem, but the level actually expected is industry- and business-model-specific. ROCE above the pre-tax cost of capital creates value, below it burns value; the four indicator families and the breakdown of ROCE are carried through by financial performance indicators.
Putting it into practice
Section titled “Putting it into practice”In five steps you can connect your own area to the three statements, without an accounting qualification.
- Obtain your organisation’s latest report or management report.
- Mark on all three tables whether it shows a period or a point in time.
- Connect the bottom line of the income statement with the balance sheet’s profit for the year, then check that the cash flow’s bottom line agrees with the change in cash between the two reporting dates.
- Calculate your area’s DSO, DIS and DPO, and record the formula used.
- Translate your latest improvement proposal into lines (which income line, which balance sheet item, when there will be cash), and bring the number into the performance dialogue at the appropriate level of the KPI cascade.
Hands-on: what happens on a sale?
Section titled “Hands-on: what happens on a sale?”The income statement and the balance sheet move at once, the cash flow only on the day of payment. Let’s take 100 units with a 30-day term.
| Statement | At once, on the day of sale | 30 days later, on payment |
|---|---|---|
| Income statement | net sales +100 | no effect |
| Balance sheet | receivables +100 | receivables −100, cash +100 |
| Working capital | +100 | −100 |
| Cash flow | no effect | +100 |
Someone has to finance the intervening thirty days.
Homework. Which balance sheet line and income line moves? (1) founding with 1 million euros, of which 800 thousand in cash, 200 thousand as contribution in kind; (2) 400 thousand of goods procurement with a 15-day term; (3) 600 thousand of sales with deferred payment; (4) a five-year bank loan. None of these breaks the equation.
Common mistakes
Section titled “Common mistakes”Three recurring reading errors, each coming from mixing up the three views.
- A single reporting-date balance sheet value for time-series analysis. Why it’s a problem: one day does not characterise the period. Instead: average the balance sheet, sum the income lines.
- Treating profit as cash. Why it’s a problem: weeks pass between recognising revenue and receiving the money, and you have to pay in the meantime. Instead: ask when this becomes actual cash.
- EBITDA fetishism on a capital-intensive asset base. Why it’s a problem: where the asset wears out, depreciation is a real cost. Instead: look at EBIT and capital employed too.
When NOT to use it (the limits)
Section titled “When NOT to use it (the limits)”The financial statement is delayed and aggregated, so it does not steer daily operations.
| Situation | Why the report is not the primary tool | The right answer |
|---|---|---|
| A shift-level, daily decision is needed | it is prepared weeks later, aggregated | performance board, KPI cascade, daily dialogue |
| The cost of poor quality should be captured | financial accounting was built for two purposes: the income statement and taxation | loss analysis, muda, root-cause analysis |
| Comparison across differing standards | the local rules differ, the figures are not comparable | data under the same standard |
| Ranking plants of differing asset age by ROCE | it measures at book value, and capital employed does not track inflation | technical indicators, asset management (ISO 55000) |
| An investment profitability decision | accrual-based profit does not measure the time value of money | discounted cash flow (DCF, NPV) |
Rule of thumb: the report tells you what happened, but not why; the operating data answers the why.
Take it home (keys)
Section titled “Take it home (keys)”- Ask of every number whether it is about a period or a point in time.
- Find your own decision’s line in all three tables: which income line, which balance sheet item, when there will be cash.
- Calculate your inventory proposal in working capital too, not only in contribution margin.
- The payment term is a price, not administration: every extra day is your money.
- With a large asset base, don’t stop at EBITDA.
Self-test
Section titled “Self-test”- A sale of 100 units with a 30-day term: in which statement does it appear at once, and in which 30 days later?
- Why must depreciation be added back in the cash flow statement, and what happens meanwhile in the balance sheet?
- What happens to working capital and to the cash-gap if the supplier payment term rises from 30 to 60 days?
Answer key: 1) At once in the income statement (sales +100) and in the balance sheet (receivables +100); in the cash flow 30 days later. · 2) Because it reduces profit without a cash outflow; in the balance sheet the accumulated depreciation rises and the net book value falls. · 3) Payables rise, working capital falls, the cash-gap shortens.
How does this show up in digital practice?
Section titled “How does this show up in digital practice?”A data trail recorded at the point of origin, and auditable, links the operating event to the financial impact.
| Principle | Digital implementation | What it delivers |
|---|---|---|
| Accrual basis | recording performance at the moment it arises | the period boundary is not a matter of estimation |
| Balance sheet as a state | inventory and asset register with a real-time state | the tied-up capital can be queried at any time |
| Cash flow as a bridge | collecting the inventory, customer and supplier movements | the working-capital days can be followed as a trend |
| Auditability | a voucher, an owner and a timestamp for every item | the financial impact is traceable to the event |
Connection to OPEREX (shift log)
Section titled “Connection to OPEREX (shift log)”A financial impact can be defended if there is an operating data trail behind it. From the records generated in the shift log (downtime and its cause, off-spec quantity, inventory movement, labour hours), the contribution, inventory and working-capital impact can be calculated; OPEREX records these shift by shift, so the evaluation is made from data.
Terminology (HU / EN)
Section titled “Terminology (HU / EN)”| Hungarian | English (canonical) | Note |
|---|---|---|
| Eredménykimutatás | income statement / profit and loss (P&L) | shows a period |
| Mérleg | balance sheet / statement of financial position | shows a single point in time |
| Cash flow kimutatás | cash flow statement | explains the change in cash |
| Eszköz-forrás egyezőség | accounting equation | assets = equity + liabilities |
| Eredményszemlélet | accrual basis | performance counts, not the cash movement |
| Céltartalék | provision | a liability of uncertain amount or timing |
| Eredménytartalék | retained earnings | prior years’ profit within equity |
| Értékcsökkenés / amortizáció | depreciation / amortisation | a non-cash expense |
| Beruházás | capital expenditure (CAPEX) | to be capitalised, spread over the lifetime |
| Működőtőke | working capital | receivables + inventory − payables |
| Kétes követelés | bad debt | an uncollectible receivable, written off as an expense |
| Pénzkonverziós ciklus | cash conversion cycle / cash-gap | DIS + DSO − DPO |
| Lekötött tőke megtérülése | return on capital employed (ROCE) | EBIT / capital employed |
What is the difference between profit and cash flow?
Profit is the difference of the revenues and expenses recognised on performance; cash flow is the actual movement of money. Profit contains non-cash items (depreciation, provisions), and does not contain items that involve a cash movement (inventory purchase, investment, loan repayment).
Which statement reveals whether the company can pay?
Primarily the cash flow statement, supplemented by the balance sheet’s liquidity ratios.
Why does working capital matter to a plant manager?
Because the inventory level, the lead time and the speed of invoicing depend on plant operations, and these decide how long you finance operations from your own money.
Related concepts
Section titled “Related concepts”financial vs. management reporting | cost structure and contribution | working capital and the cash conversion cycle | financial performance indicators | profit per hour | oee | muda | vsm | pull system | what a KPI is | KPI cascade | performance management | asset management (ISO 55000) | operational excellence
Next step
Section titled “Next step”From here it is worth going on:
- profit per hour — the logic of contribution margin at the plant level, broken down by the hour.
- oee — translating equipment loss into quantity, contribution, cash.
- ogsm — breaking down the financial goal into strategy, then into your area’s indicators.
References / further reading
Section titled “References / further reading”- IFRS Foundation / IASB: IFRS Accounting Standards (ifrs.org).
- IAS 1 — Presentation of Financial Statements (IASB) — the elements of the report set, classification criteria.
- IAS 7 — Statement of Cash Flows (IASB).
- IFRS Conceptual Framework for Financial Reporting (IASB) — the definition of an asset, a liability and equity.
- Act C of 2000 on Accounting (Hungary) — the basis of the domestic reporting obligation.
- Abol Ardalan: Economic & Financial Analysis for Engineering & Project Management. Technomic Publishing, 2000.