Asset condition management (Aci)
≈ 13 min read · 2,671 words
A bout of flu means one thing for a healthy twenty-year-old and quite another for a ninety-year-old living on medication. Yet this is exactly what we do when we judge the condition of a machine from a single momentary measurement: we leave out everything the equipment has accumulated over its life.
Asset condition management (ACM) collects and compares data and observations on an asset’s condition, and turns them into a maintenance decision.
Asset condition information (Aci) is more than the momentary state: it is the asset’s cumulative condition, built up over its whole life cycle. Its sources are the condition-based (CBM) techniques, online/IIoT sensors, human sensory observation and historical data. The key is not the collecting, but relating the data to each other and to the failure modes.
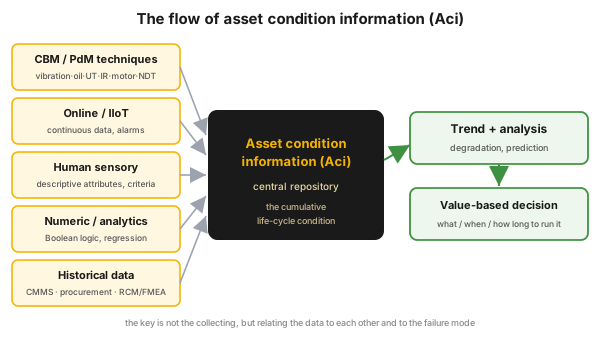 Figure 1 — the flow of Aci: many kinds of data source converge in a central repository, from which trend analysis and a value-based decision follow.
Who is this for?
Section titled “Who is this for?”This article is for those who collect data on machine condition or decide from it: reliability engineer · maintenance planner · vibration analyst · process engineer · plant manager · operator · CMMS data owner.
Learning objectives
Section titled “Learning objectives”After reading this article you will be able to:
- distinguish the momentary condition from the cumulative Aci;
- decide on an FMEA basis what to monitor, and from the P–F interval how often;
- identify the five data types, and name what each one is good for;
- recognize when it is not worth building condition monitoring.
In brief
Section titled “In brief”- Aci is the cumulative life-cycle condition, not just the momentary measurement; alongside the day-to-day decision it also predicts the future condition.
- Three questions: what to monitor (FMEA-driven), when (at half the P–F interval), how (automated consolidation, central repository, trend).
- Data types: online/IIoT · human sensory · numeric/analytics · CBM · historical. Collecting data is not a value in itself: the sources must be related to each other and to the failure mode.
- Human sensory data is the most valuable, but it has to be made reproducible with descriptive attributes; and the technique must be matched to the failure mode. Condition monitoring is a living part of the asset management system (ISO 55001).
Why it matters (the stakes)
Section titled “Why it matters (the stakes)”Seven recurring asset management decisions hang on whether you have Aci:
| Decision | The question |
|---|---|
| Shut down or keep running | how much longer will it go |
| Repair or replace | which one is worth it |
| Aligning interventions | what fits into one outage |
| Remaining useful life (RUL) | how much is left |
| Failure prediction | what is coming, and when |
| Optimal load profile | how can it last longer |
| Purchase and ownership cost | what does it cost in total |
From a single viewpoint the value of these is limited. The classic example is the conflicting KPI: the warehouse pushed to cut inventory sends back the critical spare part that protects against a high-risk failure.
What is asset condition management, and what data does it work from?
Section titled “What is asset condition management, and what data does it work from?”From all the incoming data (online sensors, CBM measurements, human observation, history) it derives the asset’s condition, and then relates this to the aggregated knowledge about that asset and about similar assets.
Within asset management this is the area that has developed fastest over the past twenty years, and the Industrial Internet of Things (IIoT) will accumulate exponentially more maintenance data over the next twenty; according to Accenture’s estimate it will represent USD 14.2 trillion of value in the global economy in 2030. An abundance of data, however, solves nothing on its own.
The three questions of condition monitoring
Section titled “The three questions of condition monitoring”It comes down to three decisions: what we monitor, how often, and how the data becomes a picture that can be interpreted in time.
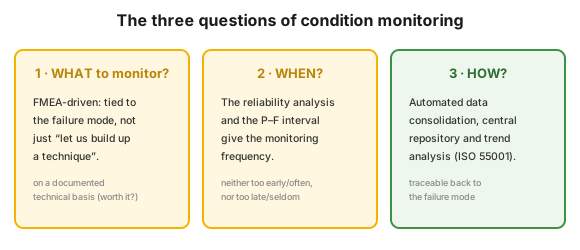 Figure 2 — what, when and how to monitor.
- What should we monitor? One approach is to “build up a technique” in an area: this grows experience quickly, but the cost/benefit may be unbalanced, and the measurement may be too early or too late, too frequent or too rare. The better route is reliability analysis: the FMEA designates which tasks reduce risk, so the monitoring has a documented technical basis.
- When should we monitor? The frequency comes from the reliability analysis, not from the OEM recommendation. The accepted method is to determine the P–F curve of the failure mode and to collect data at half the P–F period. The P–F is usually unknown, so it is estimated: a sound starting point if such a failure has occurred before, or if the trend shows it. If one measurement can catch several failure modes, the interval has to be set to the shortest P–F, and the frequency increased at commissioning, at start-up and when a developing fault is detected. For a bearing with a six-month P–F curve, daily data is enough; in a vital function the same bearing may call for immediate monitoring.
- How? The collected data must be consolidated automatically into a central repository and analysed in time, otherwise it merely “piles up in the stores”. This is what makes the degradation trends visible, and traceable back to the failure mode (ISO 55001).
The types of asset condition data
Section titled “The types of asset condition data”Five data types build up into Aci: the machine reports on itself, the human being perceives things on the machine, the algorithm finds a correlation, CBM catches the incipient fault, and the history provides the background.
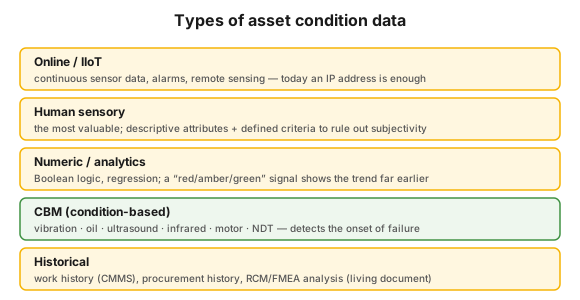 Figure 3 — the five main data types.
- Online / IIoT: many sensors collect data continuously and raise alarms; today even something that is not wired or on one site counts as “online”. Every alarm level must have an unambiguous action assigned to it, otherwise it will be ignored — possibly all the way to a catastrophic failure.
- Human sensory: the most valuable data, because a single glance from an expert replaces many sensors, yet it differs from person to person: the same part is lukewarm to one and hot to another. That is why it has to be standardized with descriptive attributes: not “inspect the machine”, but “inspect the hold-down foundation bolts”, with a closed list of answers.
- Numeric / analytics: rules and algorithms. Boolean logic reveals when several factors together point to the failure mode; predictive analytics works with linear and multivariate regression, while neural networks are so far used only at individual facilities. A “red/amber/green” signal, taken from the intersection of several parameters, shows the trend far earlier than any single parameter.
- CBM (condition-based): the techniques that detect the onset of failure. The deviation must always be interpreted together with the operating parameters: the “cavitation” indicated by vibration may be explained by a normal change in flow, in which case the prediction is negated.
- Historical: the work history (CMMS, structured by failure mode), the procurement history (fleet-level failure frequency, stock level) and the historical RCM/FMEA analysis. A good work history yields six relationships: the link between failure and condition, the cost of the failure, the frequency of failures, the success of problem solving, the relationship between the failure and the life-cycle phase, and comparison between assets.
The palette of CBM / predictive (PdM) techniques
Section titled “The palette of CBM / predictive (PdM) techniques”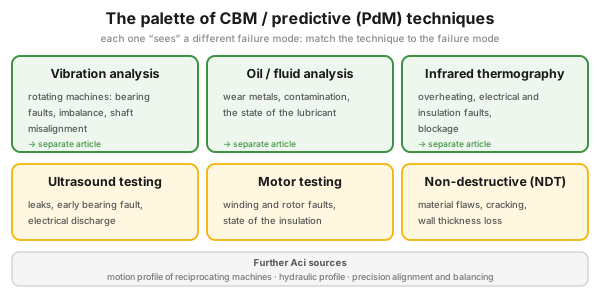 Figure 4 — the main techniques and the failure modes they detect; the technique must always be matched to the failure mode.
Each technique “sees” a different failure mode: vibration analysis sees bearing, imbalance and alignment faults; oil analysis sees wear metals and the state of the lubricant; infrared thermography sees overheating and electrical faults; ultrasound sees leaks and early bearing damage; motor testing sees winding and rotor faults; NDT sees material flaws and wall thickness loss. The motion-profile monitoring of reciprocating machines, the hydraulic profile and precision alignment data are Aci sources too. This is confirmed by the OREDA-based heat exchanger case study, which used FMEA to tie six methods (ultrasonic, eddy-current, visual and magnetic-particle inspection, helium leak testing, and the HXAM-ST condition monitor) to the failure modes, together with the probability of detection.
Worked example — online Aci down to the root cause
Section titled “Worked example — online Aci down to the root cause”A screw compressor produced a serious seal failure every year. The online data revealed that the failures correlated with the number of starts and stops: the key factor was rubbing at start-up. The solution was a pressure recirculation system, so the machine no longer had to be shut down: service life increased by 300%.
Data quality
Section titled “Data quality”A good decision needs data of adequate quantity and quality, sized to the risk being managed. Since collecting any data costs money, this is itself a decision.
| Attribute | What it means |
|---|---|
| Velocity | real-time, hourly or daily |
| Volume | the size: MB, GB, TB |
| Variety | table, photo, historian and sensor data, unstructured content |
| Veracity | the uncertainty and accuracy of the data |
Industrial and safety context
Section titled “Industrial and safety context”Condition monitoring is industry-independent, but it has a key role in the process industry: early detection prevents the forced outage and the safety event. In a hazardous (Seveso) plant CBM and the online alarm are a direct safety layer: catching an incipient seal or bearing fault prevents a release or a fire. The same consideration extends to data collection; and if continued operation is decided on despite a detected fault, the secondary consequences of a catastrophic failure must also be thought through.
Putting it into practice
Section titled “Putting it into practice”Introducing condition monitoring takes five steps:
- Start from the FMEA: let the failure modes decide what you monitor, with what, and how often.
- Derive the frequency from the P–F interval, set to the failure mode with the shortest P–F.
- Standardize human observation: descriptive attribute, specific item, closed list of answers.
- Automate consolidation: central repository, trend, an action assigned to each alarm level.
- Feed it back: Aci feeds back into asset selection, start-up procedures, operating limits, spare-part optimization, training and production forecasting. This is what keeps the RCM/FMEA a living document (ISO 55001).
Hands-on
Section titled “Hands-on”Take a measurement point that is being collected today, and run the seven information-gathering questions through it: Is it available? What does it cost, and what is it worth? What is its quality? How complete is it? In what format does it arrive? Is it used in a decision? What does it have to be compared with? If there is no answer to the sixth, the collecting is a cost without value. Repeat it with three points and you have a rationalization proposal.
Common mistakes
Section titled “Common mistakes”The pitfalls are not in the technology but in its use:
- “Data collection for its own sake”: data that piles up without value. Instead: if it has no value, do not collect it.
- Technique-driven monitoring: “we have a vibration meter, so we measure”. Instead: let the reliability analysis designate the task.
- An alarm with no action: if what to do is not unambiguous, the alarm will be ignored. Instead: every level should have an action and an escalation.
- Dropping the context: the CBM signal is read without the operating parameters. Instead: interpret it together with the process data.
- Subjective observation: without criteria the data cannot be compared. Instead: descriptive attribute, specific item, closed answers.
When NOT to use it? (the limits of the method)
Section titled “When NOT to use it? (the limits of the method)”Condition monitoring has to save more than it costs. In four situations it is not the answer:
| Situation | Why Aci is not the answer | The right move |
|---|---|---|
| The information has no decision value | collecting and storing it costs money | eliminate the measurement point |
| Low probability of detection, or a fast-developing failure | there is not enough P–F time to intervene | fixed-interval or age-based replacement, preventive maintenance |
| The supporting systems are not in place | a poorly used CMMS turns into an incoherent heap; full life-cycle Aci is an advanced concept | work management and a data repository first |
| A certified safety function is needed | a trend is not a protection layer | LOPA / SIL, IEC 61511 |
Take it home (keys)
Section titled “Take it home (keys)”- The failure mode decides, not the technique. FMEA first, equipment purchase after.
- The frequency comes from the midpoint of the P–F; if it is unknown, say out loud that you estimated it.
- An alarm with no action is not an alarm.
- Standardize human observation, do not replace it.
- Do not collect what does not affect a decision.
Self-test
Section titled “Self-test”- The P–F curve of a failure mode is six months. What is the correct data collection interval, and what modifies it?
- A vibration measurement indicates cavitation. Why do you not raise a work order immediately?
- You have been collecting a measurement point for years, but no decision has ever referred to it. What do you do?
Answer key: 1) At half the P–F; here daily data is enough. It has to be tightened if the asset is vital, if commissioning or start-up is under way, if you have already detected the fault, or if the same measurement can also catch a failure mode with a shorter P–F. · 2) Because the CBM signal has to be interpreted together with the operating parameters: a normal change in flow can also cause cavitation, in which case the prediction is negated. · 3) You eliminate it, because it is a cost without value.
How does this show up in digital practice?
Section titled “How does this show up in digital practice?”The logic of Aci does not stop at the measurement sheet: the data source–comparison–decision chain is also realized in software, by a different mechanism, on the same principle.
| Aci element | Digital implementation | What it delivers |
|---|---|---|
| Descriptive attribute, round | mobile inspection round with closed answers | reproducible data |
| CBM measurement, trend | condition data repository with trend analysis | the data does not pile up, it signals |
| Alarm level | an action and an escalation assigned to the alarm | the alarm is not ignored |
| Work history | CMMS structured by failure mode | the failure–condition link becomes visible |
| Decision | asset condition dashboard, criticality filter | the timing of the outage is built on data |
Connection to OPEREX (shift log)
Section titled “Connection to OPEREX (shift log)”Human sensory and round-based observation is the natural content of the shift log. A digital shift log (OPEREX) records the descriptive attributes with a closed list of answers, shift by shift, so a reproducible condition trend emerges. The actions assigned to alarms and the critical deviations are carried over from the outgoing shift to the incoming one with priority, and auditably.
Terminology (HU / EN)
Section titled “Terminology (HU / EN)”| Hungarian | English | Abbreviation |
|---|---|---|
| Eszközállapot-menedzsment | Asset Condition Management | ACM |
| Eszközállapot-információ | Asset Condition Information | Aci |
| Állapot-alapú karbantartás | Condition-Based Maintenance | CBM |
| Prediktív karbantartás | Predictive Maintenance | PdM |
| Ipari Eszközök Internete | Industrial Internet of Things | IIoT |
| Leíró jellemző | Descriptive attribute | — |
| Fennmaradó hasznos élettartam | Remaining Useful Life | RUL |
What is the difference between CBM and PdM?
CBM works from the actual condition; PdM adds predictive analysis (trend, regression) to estimate when the failure will come. In practice the two are intertwined.
How should we decide what to monitor?
In an FMEA-driven way: the failure modes determine which tasks are needed to reduce the risk. This gives the monitoring a documented technical basis, instead of the “we have the kit, so we measure” logic.
How often should we measure?
The accepted starting point is the midpoint of the failure mode’s P–F curve. Since the P–F is often estimated, the frequency is revised upwards by the criticality of the asset, the life-cycle phase (commissioning, start-up) and an already detected fault.
Related concepts
Section titled “Related concepts”vibration analysis | oil analysis | infrared thermography | reliability strategy | the bathtub curve | FMEA | criticality analysis | preventive maintenance | reliability KPIs
Next step
Section titled “Next step”Go on in this order:
- FMEA — this is what designates what is worth monitoring.
- vibration analysis — the most frequently introduced CBM technique.
- reliability strategy — how failure modes turn into a maintenance tactic.
References / further reading
Section titled “References / further reading”- ISO 55000 / ISO 55001 — Asset management. The standard of the asset management system; it requires the history-based analyses to be kept as living documents.
- ISO 31000 — Risk management.
- API 691 — Risk-Based Machinery Management.
- ISO 17359 — Condition monitoring and diagnostics of machines.
- Reliabilityweb.com: Uptime Elements reliability framework.