OPE, wrench time and the TTE ladder
≈ 18 min read · 3,530 words
OPE (Overall Performance Effectiveness) splits a shift’s time into value-adding, incidental and waste; wrench time is its maintenance metric.
The incidental part is necessary for operation but does not directly produce value. Wrench time is the maintainer’s actual value-adding working time out of the whole shift: the international best practice is 50–60%, while the observed figure is often only 25–30%. The two concepts are tied together by TTE (Total Team Effectiveness), the capacity ladder that works down from contract hours step by step — deducting the absence, the hours not available, the productivity loss and the effectiveness loss — to the effective, value-adding hours. OPE is the human counterpart of the equipment-focused OEE: it makes visible the efficiency not of the machine’s, but of the human’s time.
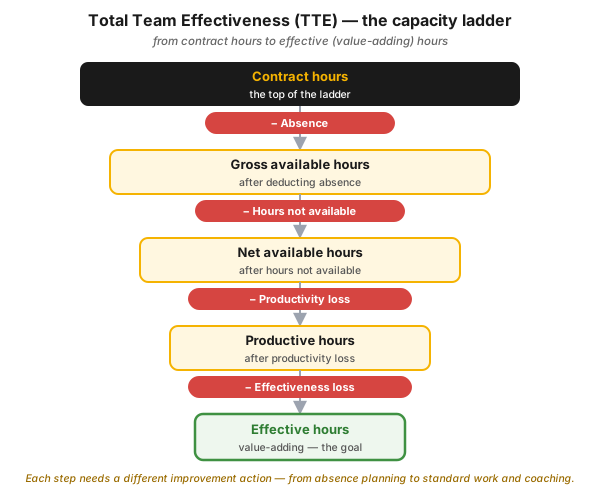
Figure 1 — the Total Team Effectiveness (TTE) capacity ladder. From the contract hours we deduct, step by step, the absence, the hours not available, the productivity loss and the effectiveness loss, and so we arrive at the effective (value-adding) hours. A different improvement action belongs to each rung.
Who is this for?
Section titled “Who is this for?”This article is for those who live with shift time, the organization of work and the efficiency of maintenance: shift supervisor · plant manager · operator · maintainer and maintenance planner · reliability engineer · Lean/CI coordinator · production and maintenance manager · HSE specialist.
Learning objectives
Section titled “Learning objectives”After reading this article you will be able to:
- explain what OPE measures, and in what sense it is the human counterpart of OEE;
- split a shift’s time into value-adding, incidental and waste categories;
- interpret the rungs of the TTE capacity ladder, and assign the right improvement action to each;
- say what wrench time is, what the best practice is, and why the bulk of the loss is system-level;
- run a waste shadowing observation, and set a target state for the value-add share.
In brief
Section titled “In brief”- OPE = the efficiency of the human’s time. It splits a shift’s time into three categories: value-adding, incidental (necessary but not value-adding) and waste. This is the human equivalent of OEE.
- Wrench time is the maintainer’s value-adding time: the best practice is 50–60%, the observed reality is often only 25–30%. The difference consists largely of waiting, transportation and “not at a job site” time.
- TTE is the capacity ladder: deducting absence from the contract hours gives the gross available hours, deducting the hours not available gives the net available, then deducting the productivity loss gives the productive hours, and finally deducting the effectiveness loss gives the effective hours.
- Every rung has its own improvement action: reducing the illness rate and overtime, trimming meeting time, standard work instructions, individual performance management and coaching, process redesign.
- Observed example: for outside operators roughly 34% value-adding / 22% incidental / 44% waste; for inside operators roughly 26% / 35% / 39%.
- The way to measure it is waste shadowing: structured, full-shift observation (in one observed case ~70 man-hours), classifying the activities into three categories.
- The method comes from the McKinsey toolkit; it is used in the diagnostic and design phase to identify inefficiencies within the available capacity.
Why it matters (the stakes)
Section titled “Why it matters (the stakes)”We have long measured the condition of the machine, but the efficiency of human working time often stays a dark spot without a metric. And the stakes are high: in a continuously operating facility, human working time is the largest yet least visible resource.
If this spot is left unmeasured, the loss accumulates quietly. The maintainer may spend half of their working time waiting, searching and on the move, while the indicators report “full headcount.” A shift’s value-adding time can drop to a half or a third without anyone knowing where it is lost, so a capacity shortage is signalled even where in reality there is hidden waste. And badly measured capacity breeds needless overtime, rushing and improvisation — which in a Seveso plant is a direct safety risk.
What are OPE, wrench time and TTE, and how much of a shift is value-adding time?
Section titled “What are OPE, wrench time and TTE, and how much of a shift is value-adding time?”In short: OPE measures the efficiency of human working time, wrench time is its maintenance-facing indicator, and TTE is the capacity ladder from contract hours to effective hours. The observed value-adding time is often only 25–30% of a shift, while the international best practice is 50–60%.
OEE measures the efficiency of the equipment (availability × performance × quality). The performance of a continuously operating process-industry facility, however, is determined not only by the machines but also by people’s time, and this often stays a dark spot. OPE (Overall Performance Effectiveness) lights up that spot: it quantifies the efficiency of human work in an organization or in an end-to-end process. This is exactly the purpose of the method: OPE serves to identify the sources of inefficiencies.
OPE and the TTE (Total Team Effectiveness) that belongs with it are tools of the Lean diagnostic and design phase. Their strength is that they identify and quantify the inefficiencies within the available capacity; their limit is that the quantification depends on the quality and quantity of the observation. The two concepts build on one another logically: TTE shows how many useful hours are available at all (what remains of the contract hours), while OPE shows what within that the time is spent on.
The method in detail
Section titled “The method in detail”The method consists of three concepts that build on one another: OPE splits a shift’s time into three categories, TTE works down the capacity ladder to show how many effective hours remain out of the contract hours, and wrench time applies the same logic to the maintainer’s working time. In order:
OPE — the three categories of a shift’s time
Section titled “OPE — the three categories of a shift’s time”OPE sorts the time of a shift (or a process) into three mutually exclusive categories:
- Value-adding: what the customer — ultimately — pays for; the process moves forward because of it (e.g. carrying out an adjustment, the actual maintenance of a valve).
- Incidental: necessary for operation, but does not directly create value — for example maintenance preparation, supervision, handling alarms, checking routes. The goal is not to eliminate it but to reduce it.
- Waste: superfluous activity that is not needed even now — waiting, unnecessary motion, re-handling, needless administration.
Practice also gives concrete observed shares. In one observed case, for the outside operators, based on about 70 hours of observation: 34% value-adding, 22% incidental, 44% waste. For the inside (control-room) operators the picture is similar with a different distribution: 26% value-adding, 35% incidental, 39% waste. The lesson is clear: the share of value-adding time can be improved considerably.
TTE — the capacity ladder (see Figure 1)
Section titled “TTE — the capacity ladder (see Figure 1)”TTE is McKinsey’s “capacity ladder”: it works down step by step how many effective (value-adding) hours remain out of the contract hours. The terminology and the deductions of the ladder:
| Level | Deduction | Result |
|---|---|---|
| Contract hours | − Absence | Gross available hours |
| Gross available | − Hours not available | Net available hours |
| Net available | − Productivity loss | Productive hours |
| Productive hours | − Effectiveness loss | Effective hours |
The strength of the ladder is that a separate improvement action belongs to each single rung: not one single “let’s work more” message, but targeted interventions (see the measurement/action section).
Wrench time — the maintainer’s value-adding time (see Figure 2)
Section titled “Wrench time — the maintainer’s value-adding time (see Figure 2)”Wrench time is the established indicator that applies the TTE/OPE logic to maintenance: the maintainer’s actual, hands-on value-adding work relative to the total working time (e.g. 40 hours/week). The biggest causes of wrench-time loss are waiting, transportation, and the fact that the maintainer largely does not even have to be at the job site.
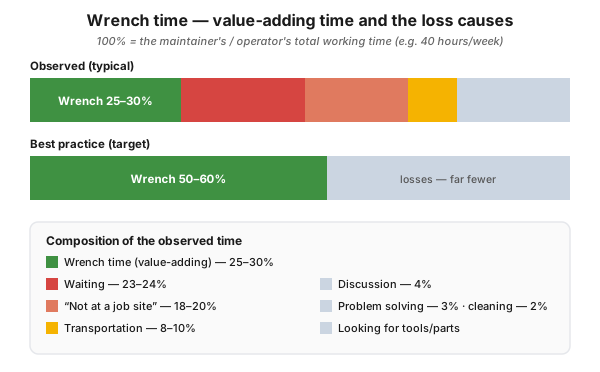
Figure 2 — the breakdown of wrench time. The observed value-adding time is often only 25–30%, while the best practice is 50–60%. The main loss causes: waiting (23–24%), “not at a job site” (18–20%), transportation (8–10%), plus discussion, problem solving, cleaning and looking for tools.
The observed composition (total working time = 100%):
- Wrench time (value-adding): 25–30%
- Waiting: 23–24%
- “Not at a job site”: 18–20%
- Transportation: 8–10%
- Discussion: 4% · Problem solving: 3% · Cleaning: 2% · Looking for tools/parts
So the best-practice wrench time of 50–60% does not come from maintainers “turning wrenches faster,” but from eliminating the waste around them: shortening the wait for a work permit, putting tool and spare-part logistics in order, and making sure the maintainer spends their time at the job site rather than on the move or in the office.
Process-industry context and safety
Section titled “Process-industry context and safety”Process-industry observations identified concrete losses: draining steam generators, sampling, supervising pump disassembly, needless walking and administration. The most typical of the eliminable items:
- double sample recording (the same analytical result is recorded both on paper and electronically),
- leaving the job site to have the work permit signed (because of the paper-based permitting, the outside operator often has to leave the work area),
- keeping the shift log (Opralog) in parallel on paper and electronically, and the needless duplication of the inside operators’ two separate books.
In one fuel-producing block, the observation found that maintenance preparation, supervision and the checking routes accounted for the main incidental/waste activity. Reaching the target state in the block can mean a saving of man-hours on an annual scale, and this is not only cost: a more stable, more predictable shift also means safer operation. In a Seveso plant, less needless walking, a shorter wait for a work permit and a maintainer who is present on site and not rushing are a direct safety benefit: haste and improvisation are the breeding ground of errors and accidents. Reducing waste, however, may never come at the expense of safety: complying with the permitting and Ex requirements is itself value-adding, not “waiting” to be trimmed away.
Putting it into practice — the waste shadowing method
Section titled “Putting it into practice — the waste shadowing method”OPE is measured by structured observation (shift observation / waste shadowing). The sequence of steps you can run in practice:
- Collect the background data — shift log (typically Opralog), headcount/shift size, skill matrix (skill matrix).
- Observe the whole shift — in one observed case ~70 man-hours of observation with outside operators (with supplementary observation of inside operators); the observer records every activity and sorts it into the three categories (on separate sheets for the shift work, the shift handover and the checking routes).
- Hold pain-point workshops and interviews — in one observed case 4 pain-point workshops plus interviews with block leaders, plant managers, shift supervisors and operators.
- Supplement it with an employee survey — to complement the observation; in one observed case with an anonymous weekly mood pulse covering the whole unit of about 78 people.
- Set a target state and initiatives — set the future value-add share (in one observed case reducing waste from ~30–35% to 15–20%; the ~15% freed up this way mostly slides into the value-adding time, which by estimate can push the value-adding share toward ~40–45%) and the actions leading there (e.g. a shared, structured shift handover, targeted training, standard work).
Unit-level diagnostics — one observed case
Section titled “Unit-level diagnostics — one observed case”In a 78-FTE distillation unit (2 blocks, 7 plants in total), the Wave-1 diagnostics used ~70 man-hours of observation, interviews and 4 pain-point workshops. The observation revealed four main areas for development: resource utilization, standardization, performance management and capability building. The quantified picture and the target set:
| Indicator | Observed (before) | Target |
|---|---|---|
| Value-adding working time (outside operator) | 25–30% | ~40–45% (estimate) |
| Incidental | 35–40% | more focused (e.g. on autonomous maintenance) |
| Waste | 30–35% | 15–20% |
| Variation of the checking routes between operators | up to ~30% | standardized |
| Time that can be freed up | — | ~40–50 minutes / shift / operator |
The lesson is not that “we have to work faster,” but that standardization and focused resource allocation free up ~40–50 minutes of useful time per shift and per operator, which can be turned to value-adding (e.g. autonomous maintenance) activity.
The method teaches a lot even done once, but it is truly effective when it is regular: in the longer run, data extracted from the shift log takes the place of manual shadowing (see the OPEREX connection).
Measurement and the improvement actions — rung by rung
Section titled “Measurement and the improvement actions — rung by rung”The TTE ladder is useful because it assigns the improvement to the right rung. A typical action list rung by rung:
| Loss (rung) | Typical improvement initiative | |
|---|---|---|
| Absence | Reduce the illness rate; holiday and absence planning | |
| Hours not available | Reduce overtime; better capacity planning | |
| Productivity loss | Reduce meeting/project time; trim overhead activities; break and lunch discipline; capacity planning so that work does not stand still | |
| Effectiveness loss | Standard work instructions; individual [[performance-management.en | performance management]]; coaching inside and outside the team; process redesign; continuous focus on waste elimination |
The logic is the same as in the indicator hierarchy: do not flog the end result (effective hours), but improve the specific rung that causes the loss.
Common mistakes
Section titled “Common mistakes”- Confusing OPE with OEE. OEE is the efficiency of the machine’s time, OPE that of the human’s: the calculation differs and so does the intervention.
- Holding the maintainer accountable for improving wrench time. The bulk of the loss is system-level (waiting for a permit, tool logistics), and it does not improve by “turning wrenches faster.”
- Drawing far-reaching conclusions from a single observation. Quantifying OPE depends on the quantity and representativeness of the observation (the method itself warns about this limit).
- Treating incidental activity as waste. Supervision, a checking route or permitting are necessary: they should be reduced, not driven to zero.
- Setting a target state without actions. The value-add share does not improve by itself; every TTE rung needs a concrete initiative with a named owner.
- Classifying safety/permitting time as “waste.” Compliance is value-adding; trimming it leads toward errors and accidents.
When NOT to use it (the limits of the method)
Section titled “When NOT to use it (the limits of the method)”OPE/wrench time is a strong diagnostic tool for the losses of human working time, but it is not the right answer to every problem. Knowing the limits is at least as important as the method itself:
| Situation | Why not primarily OPE | The right answer |
|---|---|---|
| The bottleneck is the availability or performance of the equipment | OPE measures the human, not the machine | OEE, TPM, reliability analysis |
| The loss is caused by poor process flow (lead time, many changeovers) | reallocating working time does not eliminate the poor process | process redesign, muda hunting, VSM |
| Only few, non-representative observations are available | from a single shift the shares are misleading | more shifts, day/night and multi-day observation before you set a target |
| The goal is justifying/reducing headcount in itself | OPE is about eliminating waste, not about layoffs; used that way, the measurement loses trust | allocate the freed-up time to value-adding (e.g. autonomous maintenance) work |
Rule of thumb: OPE is the best answer to the question where is human working time lost. For an equipment, flow or reliability problem it does not replace the appropriate tool, but complements it.
Take it home (keys)
Section titled “Take it home (keys)”- Human working time is a measurable resource too. OPE makes human loss visible just as OEE makes machine loss visible; start by sorting the shift’s time into three categories.
- The loss in wrench time is system-level. The best practice of 50–60% does not come from turning wrenches faster, but from eliminating waiting, searching and time on the move; improve there.
- Every TTE rung has its own action. Do not flog the end result (effective hours), but improve the specific rung that causes the loss.
- Incidental is not the enemy. Reduce and focus supervision and the checking route, do not zero them out; safety/permitting time is value-adding.
- Measure representatively, then set a target. After observing several shifts, set a value-add target and tie it to concrete initiatives with named owners.
- Safety takes priority. The time freed up gives a more stable, more predictable shift, which in a Seveso plant is a safety benefit in itself.
Self-test
Section titled “Self-test”- How do OPE and OEE differ, and what exactly does OPE measure out of a shift’s time?
- The best practice for wrench time is 50–60%; name three typical reasons why the observed figure is often only 25–30%, and say whose responsibility it is to eliminate them.
- In an operator’s shift the waste is 30–35%. Which concrete action would you assign to which TTE rung so that the value-add share grows?
How does this show up in digital practice?
Section titled “How does this show up in digital practice?”The logic of OPE does not stop at manual shadowing observation: the same principle is realized in software too. Instead of the observer’s paper time sheet and stopwatch, here a timestamped event and activity log, a digital work permit and a capacity dashboard make the value-add share continuously visible — the mechanism differs, the principle is the same.
| Concept / routine | Digital implementation | What it delivers |
|---|---|---|
| Activity categories (VA / incidental / waste) | timestamped event and activity log | the value-add share can be computed continuously, without manual shadowing |
| Loss causes of wrench time (waiting for a permit, searching) | digital work permit + tool/spare-part register | waiting and searching time becomes measurable and can be shortened |
| Double administration | single-place, digital logging | the parallel logbook disappears, less waste |
| Shift handover | structured, digital handover template | on the gemba, uniformly, traceably |
| TTE rungs (absence, overtime, meetings) | automatic time and capacity data, dashboard | the loss shows up on the right rung, not blurred together |
Connection to OPEREX (shift log)
Section titled “Connection to OPEREX (shift log)”The base data of waste shadowing come largely from the shift log (Opralog), and this is exactly where the circle closes. The three biggest loss causes of wrench time (waiting for a work permit, looking for tools/parts, double administration) are precisely the type of event that a digital shift log records in a structured way, with a timestamp. The OPEREX shift log thus increases value-adding working time in three ways: (1) single-place, digital logging replaces the parallel logbooks (it eliminates double administration and CC6-type duplication); (2) the structured shift handover held on the gemba replaces the handover done “without work clothes, away from the job site”; (3) the activities and events during the shift add up from the log into a value-add analysis continuously, without manual shadowing as well. The observation becomes a live indicator instead of a one-off snapshot.
Terminology (HU / EN / JP)
Section titled “Terminology (HU / EN / JP)”| Hungarian | English (canonical) | Note |
|---|---|---|
| emberi teljesítmény-hatékonyság | OPE — Overall Performance Effectiveness | the human counterpart of OEE |
| csapat-hatékonyság (kapacitás-létra) | TTE — Total Team Effectiveness | contract → effective hours |
| csavarkulcs-idő | wrench time | the maintainer’s value-adding time |
| értékteremtő | value-adding | what the customer pays for |
| kisegítő / járulékos | incidental | necessary, but not value-adding |
| veszteség | waste / loss | superfluous, to be eliminated |
| szerződéses órák | contract hours | the top of the ladder |
| effektív órák | effective hours | the bottom of the ladder (the goal) |
| megfigyelés (árnyékolás) | waste shadowing / shift observation | the method of measurement |
| ütemezett munkaengedély | permit to work | a frequent cause of waiting |
What is the difference between OPE and OEE?
OEE measures the efficiency of the equipment (availability × performance × quality), while OPE (Overall Performance Effectiveness) measures the efficiency of human work: the value-adding / incidental / waste shares of a shift’s time. OPE is the human counterpart of OEE.
What is the best-practice value of wrench time?
According to the international best practice, maintainers’ wrench time (their actual value-adding time) can be 50–60%, while the observed figure is often only 25–30%. The difference comes largely from waiting (23–24%), time spent “not at a job site” (18–20%) and transportation (8–10%).
What is TTE (Total Team Effectiveness)?
A capacity ladder that works down from the contract hours step by step — deducting the absence, the hours not available, the productivity loss and the effectiveness loss — to the effective, value-adding hours. A separate improvement action belongs to each rung.
What is incidental activity in a shift?
Activity that is necessary for operation but does not directly create value — for example maintenance preparation, supervision or checking routes. The goal is to reduce it, not to eliminate it entirely.
How is the share of value-adding time measured?
By structured, full-shift observation (waste shadowing). In one observed case ~70 man-hours of observation gave enough data to determine the activity shares; the observation is complemented by pain-point workshops, interviews and an employee survey.
Related concepts
Section titled “Related concepts”OEE · muda · the three types of activity · standard work · shift handover · training and onboarding · performance management · indicator hierarchy · gemba walk
Next step
Section titled “Next step”If you have understood this, from here it is worth going on — in this order:
- OEE — the equipment-efficiency counterpart; together they show where capacity is lost on the machine and on the human.
- standard work — the main remedy for the effectiveness-loss rung: uniform, repeatable work.
- shift handover — the structured handover held on the gemba, which eliminates one of the biggest sources of wrench-time and incidental-time loss.
References / further reading
Section titled “References / further reading”- Doc Palmer: Maintenance Planning and Scheduling Handbook. McGraw-Hill — wrench time (the maintainer’s value-adding time) as the key indicator of planning and scheduling, plus the canonical treatment of the typical loss causes.
- SMRP (Society for Maintenance & Reliability Professionals): Best Practices metric set — the industry definition of wrench time / “craft work time” as a reliability productivity indicator.
- Solomon Associates: operations and maintenance benchmarking (personnel and maintenance efficiency indices), which gives an industry reference point for the observed wrench time.