OEE: Overall Equipment Effectiveness
≈ 19 min read · 3,891 words
An expensive machine sits in the middle of the line, and at the end of the week someone asks: “how well did we use it?” One shift supervisor says it ran fine, the second says it stood still a lot, the third complains about quality objections. Three people, three gut feelings, not a single number. OEE closes exactly this argument: it compresses into one percentage how much the equipment delivered against its possible maximum. Let’s look at what OEE is, how you calculate it from its three factors, and what it is really good for.
OEE (Overall Equipment Effectiveness) measures how well equipment runs compared to the theoretical goal: OEE = Availability × Performance × Quality.
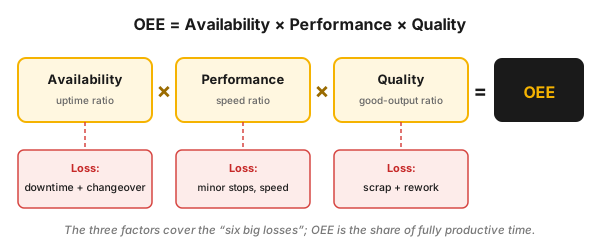 Figure 1 — OEE is the product of the three factors; together they cover the six big losses.
Who is this for?
Section titled “Who is this for?”This article is for those who live day to day with the utilization and performance of a piece of equipment or a unit: operator · shift supervisor · plant manager · production manager · maintenance / reliability engineer · Lean/CI coordinator · process engineer.
Learning objectives
Section titled “Learning objectives”After reading this article you will be able to:
- explain what OEE measures, and what its three factors are made of;
- calculate the Availability, Performance and Quality values, then OEE, for a process-industry unit;
- interpret why a narrow measurement scope (a pilot) and a full time breakdown give different answers for the same unit;
- decide when it is worth measuring OEE, and when it is misleading;
- launch an OEE measurement with a baseline, a loss ranking and kaizen.
The essence (TL;DR)
Section titled “The essence (TL;DR)”- OEE compresses into a single number how well a piece of equipment runs compared to the theoretical maximum: OEE = Availability × Performance × Quality.
- The three factors cover three loss families: availability (downtime, changeover), performance (minor stops, speed loss), quality (scrap, rework). These three together are the six big losses of TPM.
- The product is multiplicative: a weakness in any one factor degrades the end result disproportionately.
- The diagnostic power of the metric is greatest when you look at one specific machine or line; as the usage “broadens” (line → plant → site), its analytical value drops quickly.
- Typical deployment spots: a bottleneck machine and a high capital cost asset where utilization must be raised.
- Process-industry example: the OEE of an FCC unit was 77.9% in 2013 in the full time breakdown (A = 83.8%, PE = 93%, Q = 100%); an earlier pilot on the same unit gave 81%.
- OEE is not an end in itself: a root-cause problem-solving culture (5 Whys, PDCA) raises OEE, productivity and motivation at the same time.
Why does it matter? (the stakes)
Section titled “Why does it matter? (the stakes)”On a high capital cost asset, every hour of standing still or running slowly is money you can never bring back. The stakes are high because the losses hide behind one another: the machine “was running,” so it must be fine — meanwhile it runs below rated speed with minor stops, and at the end a batch goes to rework. Individually each is small; together they can take away a quarter of the capacity.
The strength of OEE is that it brings the three kinds of loss onto a common denominator, time, so one cannot be covered up with another. A 1% availability shortfall in continuous operation means about 3.65 days of lost output a year; a “mere” 93% performance means several weeks of production a year. The number on its own does not improve anything, but it forces you to face the biggest loss line.
What is OEE, and how do you calculate it from its three factors?
Section titled “What is OEE, and how do you calculate it from its three factors?”OEE is a “best practice” method to measure how well equipment is running when compared to the theoretical goal, and it compresses three kinds of loss into a single number. The calculation is always time-based (one year ≈ 8760 hours) and consists of three factors multiplied together:
- Availability (A) — how much of the available time the machine actually ran (downtime and changeover loss).
- Performance (P) — how fast it ran compared to its rated speed (minor stop and speed loss).
- Quality (Q) — how much of the produced quantity was good first time (scrap and rework loss).
The result: OEE = A × P × Q. Since it is a product, one weak factor drags the whole metric down: 90% × 90% × 90% is already only 72.9%.
Where does it come from? OEE is a hierarchy of metrics developed by Seiichi Nakajima in the 1960s, within the framework of TPM (Total Productive Maintenance). The processed bootcamp materials place it in this tradition, in the “productivity” KPI category of the Lean Operating System, alongside the t/hour vs. plan and equipment availability metrics. The definition reads: OEE is “a measure used to analyze equipment performance. This analysis measure aggregates losses due to availability (breakdowns + changeovers), performance (minor stops + speed loss) and quality problems (scrap + rework).”
The three factors = the six big losses. TPM breaks the three OEE factors down into six concrete losses (six big losses), and the red bands of Figure 1 mark exactly these:
| Factor | The two big losses it covers |
|---|---|
| Availability | breakdown · setup and adjustment (changeover) |
| Performance | minor stoppage · speed loss |
| Quality | quality defect and rework (scrap/rework) · startup yield loss |
The strength of the metric is that it compresses all of this into a single number, so it quickly shows “how well the machine is running.” The usage does have an important limit, though: OEE is best as an analysis tool when it refers to one machine, line or plant. The broader the field of application (e.g. an entire site in one number), the less usable it is for generating specific improvement ideas.
When is it worth introducing? Two typical situations stand out:
- A bottleneck machine that is constraining the capacity of the value stream to meet customer needs.
- High capital cost equipment where utilization must be raised (classic examples: injection moulding, die casting, pressing; in the process industry, naturally, the main technological units and loading arms).
The primary benefit of OEE is that it makes a firm more competitive: it makes the effectiveness of the equipment measurable and creates a baseline from which the productivity of a machine or a production line can be improved.
How it works (detailed steps / elements)
Section titled “How it works (detailed steps / elements)”OEE is the product of three components. The processed materials use two equivalent notations; the table below brings them together.
| Component | What it measures | Loss source | Formula |
|---|---|---|---|
| Availability (A) — availability | Did the machine really run when it was supposed to | Breakdown + changeover | A = (available time − downtime) / available time |
| Performance (P) — performance (other notations: Performance efficiency / Productivity / SL) | Did it run at the given speed | Minor stop + speed loss | P = (operating time − speed losses) / operating time, or = actual produced amount / theoretical max capacity during operating time |
| Quality (Q) — quality | Was what came out good | Scrap + rework | Q = (processed amount − defects) / processed amount = good amount / total produced amount |
The full formula:
OEE = Availability × Performance × QualityOEE = A × P × QIn the compact notation of the bootcamp notes (066/067/068):
OEE = A × SL × QA = Uptime / Scheduled production time (availability)SL = Total Produced amount / Theoretical max capacity during Uptime (speed/performance)Q = Good amount / Total produced amount (quality)The logic of the time breakdown (the time-loss pyramid). The essence of OEE is that the losses are subtracted step by step from the total time (Total Time), and what remains at the end is the genuinely value-creating time that produced good product:
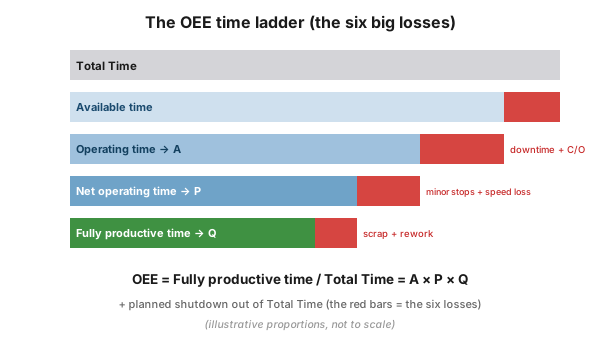 Figure 2 — the OEE time ladder: after the losses are subtracted step by step from the total time, the fully productive time remains.
An important process-industry detail: in the FCC example, availability is calculated from the weekly production plan (Scheduling), and planned shutdown and unplanned shutdown are handled separately. “Deviation from plan” and “Non-utilized capacity” appear as loss lines of their own. The starting theoretical capacity of the calculation is typically derived on a 365 days × 24 hours (≈ 8760 hours) basis.
Process-industry context + safety
Section titled “Process-industry context + safety”In the process industry (crude oil processing, petrochemicals, logistics) OEE is applied to specific assets. The “machine” is then a unit or a piece of equipment, and the stop can be planned (turnaround/shutdown) or an unplanned trip.
- FCC (Fluid Catalytic Cracking) unit. In a 2012 pilot run by the energy and yield stream, the “actual OEE” was 81%; the loss breakdown was split between breakdowns, capacity utilization and one quality issue requiring rework. A 2013 full time breakdown built on the maintenance database brought the same unit out at 77.9%: Availability 83.8%, Performance 93%, Quality 100%. The availability loss comes from planned shutdown (5.6%, 8 times) and unplanned shutdown; the performance loss comes from deviation from plan (3.1%), non-utilized capacity and 24 speed-loss events (speedloss). The two numbers (81% pilot vs. 77.9% full time breakdown) show well that the measurement scope and the time model determine the result.
- CDU (atmospheric distillation) unit — an illustrative example (not corpus data). To illustrate the calculation applied to a continuous unit: if out of 365 days a year there are 42 days of planned and about 15.9 days of unplanned stops, then A = (365 − 42 − 15.9) / (365 − 42) ≈ 95.1%; if P ≈ 94.0% and Q = 100% go with it, OEE ≈ 89.4%. (The concrete numbers serve only to illustrate the method; they are not actual data.)
- Loading arms at a plant site’s loading rack (2013, hourly basis). The losses: speed loss (speedloss), changeover time (C/O time) and not utilised loading arms. This shows well that OEE can be interpreted not only for a “machine” but also for a logistics asset.
- VSM context. In the value stream map (Gasoline production example: Crude storage → CDU → Processing → Blending), OEE is written next to every technological node alongside energy consumption and headcount, i.e. OEE is a standard attribute of the individual steps of the value stream.
Safety / cultural note. In the process industry, availability and stoppages are not only production but also safety questions. The same logic applies as in the Jidoka–Andon principle: the fault must be recognized, signalled immediately and stopped, then prevented with a short-term and a long-term action. The right way to raise OEE is therefore not to cover up the problems (e.g. “hiding” stoppages), but to eliminate the root causes. According to the processed material, instituting a root-cause problem-solving culture “leads to higher OEE, higher productivity, and a highly motivated workforce.”
Introduction in practice (roadmap: pilot → rollout)
Section titled “Introduction in practice (roadmap: pilot → rollout)”OEE is best introduced not on its own but embedded among the tools of the Lean Operating System. The roadmap below follows the bootcamp logic (pilot → rollout).
1. Select the target equipment (who: Lean PMO + plant manager). Do not introduce it everywhere. Choose one bottleneck or high capital cost asset where there is a real business need to raise utilization (e.g. FCC, a loading arm). It is worth narrowing the pilot to one stream (in the proven practice: “energy and yield stream in Pilot”).
2. Fix the time model and the loss categories (who: plant engineer + shift supervisor). Define unambiguously: what Total Time is, what counts as a planned stop (PM, scheduled shutdown), what downtime is (breakdown, changeover), what speed loss and minor stop are, and how you identify scrap/rework. Derive the basis of availability from the weekly production plan (Scheduling).
3. Collect data on the gemba principle (San Gen Shugi). Never look for root causes in an Excel sheet: the fault codes must be recorded at the real place, on real data. Collect the downtime and loss causes in a structured way, at event level (shift log, downtime codes), otherwise the OEE number “exists but does not act.”
4. Calculate the baseline OEE. Calculate the three components and their product. This is the starting point against which you measure the improvements.
5. Loss ranking and kaizen. Target the biggest loss line with a kaizen event and a PDCA cycle. The tool assignment: changeover → SMED, disorder/searching → 5S, variation → standard work, root cause → 5 Whys / PDCA.
6. Visualization and daily dialogue (MOS). Put OEE and its components into the daily/weekly performance dialogue (KPI board, performance dialogue). OEE is one of the 5 KPI categories (productivity), alongside customer satisfaction, quality/risk, people and continuous improvement.
7. Rollout in waves. Spread the proven measurement and improvement logic to further plants in waves, but at every new place keep the principle “one machine = one interpretable OEE,” so that the metric does not “flatten out.”
Measurement / audit
Section titled “Measurement / audit”| Metric | Formula | What it signals / target logic |
|---|---|---|
| Availability (A) | (available time − downtime) / available time = Uptime / Scheduled time | Downtime and changeover loss; goal: unplanned downtime → 0, changeover → shorter with SMED |
| Performance (P) | (operating time − speed losses) / operating time = actual / theoretical max capacity | Minor stops and slow running; goal: hold the rated speed, eliminate the minor stops |
| Quality (Q) | (processed − defects) / processed = good / total | Scrap + rework; goal: first-time-right |
| OEE | A × P × Q | Aggregated effectiveness; measured against the baseline, what counts is the direction and pace of the improvement |
Audit principle. The audit of OEE is not primarily about the correctness of the number, but about whether (1) the loss categories are unambiguously defined, (2) the data is created on the gemba, from a real event (not an after-the-fact estimate in Excel), and (3) there is an open improvement action with an owner attached to the biggest loss line. Target logic: the processed material gives no fixed industry benchmark for OEE, so the trend relative to your own baseline is what counts; the goal is to make the loss lines “leaner” (the catchphrase: “Target is to make them leaner!”).
Note: The roughly 85% “world-class OEE” target quoted as an industry commonplace is an established value in the Lean literature, but it does not appear in the processed materials, so do not communicate that as the target — communicate the improvement of your own baseline instead.
Hands-on / worked example
Section titled “Hands-on / worked example”FCC OEE — the definitive worked example (2013, based on the maintenance database). Input data:
Theoretical capacity: 164.58 t/h = 3,950 t/day = 1,441,750 t/yearScheduled stop: 931.5 hUnplanned stop: 485.9 hGood quantity produced: 1,123,787 t/yearQuality (Q): 100%The calculation:
A = (8760 − 931.5 − 485.9) / 8760 = 83.8%PE = 1,123,787 / ((8760 − 931.5 − 485.9) × 164.58 t/h) = 93%Q = 100%OEE = A × PE × Q = 0.838 × 0.93 × 1.00 = 77.9%The same in the time ladder (pyramid), calculated from the weekly production plan:
100.0% Total Time - planned shutdown: 5.6% (8 times) - unplanned shutdown 83.8% Availability - deviation from plan: 3.1% - non-utilized capacity, 24 speedloss events 77.9% OEE (PE = 93%, Q = 100%)An earlier pilot measurement on the same FCC gave an “actual OEE” of 81%, where the gaps were caused by breakdowns, capacity utilization and one quality issue requiring rework. The two numbers illustrate well that the measurement scope and the time model determine the result, which is why the definitions must be fixed in advance.
A heijunka lesson (a related example). In the loading-station simulation (20 minutes of loading per truck, 10 minutes of changeover), purely by scheduling the trucks (leveling, without investment) a 20% higher truck count and 14% more loaded quantity came out. The same OEE logic applies: the “workload” KPI showed that 50% of the capacity was free, i.e. poor Performance/Availability is often not an equipment problem but a scheduling problem.
Common mistakes
Section titled “Common mistakes”- “One number for the whole site.” The broader the scope, the less usable OEE is for concrete improvement. Keep it at machine/line level.
- Root-cause hunting in Excel. The San Gen Shugi lesson: the fault codes must be analyzed at the real place, on real data; the “22 pieces of fault code A2, but we don’t know what it is, let’s move on” antipattern read out at the weekly meeting condemns OEE to death.
- Blurring the loss categories. If planned and unplanned stops, or speed loss and minor stops, are not separated, the OEE number exists but gives no direction for improvement.
- Treating OEE as an end in itself. OEE is a diagnostic tool, not a trophy. Simply pushing the number up (e.g. by “loosening” the plan) is worth nothing: the goal is the actual elimination of the losses.
- Hiding problems for the sake of a higher number. The opposite of the Jidoka principle; the hidden stoppage comes back later as a safety and quality problem.
When NOT to use it? (limits of the method)
Section titled “When NOT to use it? (limits of the method)”OEE is a strong diagnostic tool, but it is not the right answer to every question. Knowing the limits is at least as important as the formula itself:
| Situation | Why not primarily OEE | The right answer |
|---|---|---|
| You want a single number for a whole plant / site | the broader the scope, the less it shows a concrete improvement direction | keep it at machine/line level; for site level rather an OEE portfolio or a Solomon benchmark |
| The loss is really poor process flow (waiting, many changeovers, no leveling) | OEE measures equipment utilization, not the flow of the value stream | VSM, flow, leveling (heijunka), SMED |
| The machine is not a bottleneck, and there is plenty of capacity | pushing up the OEE of a non-bottleneck often causes over-production (muda) | focus on the bottleneck first (Theory of Constraints logic) |
| You want to measure human / team effectiveness, not equipment | OEE is equipment-oriented | OPE / TTE is the appropriate related metric |
| There is no reliable, event-level data on the stops and losses | an OEE calculated from estimates “exists but does not act” | first gemba data collection (shift log, downtime codes), then OEE |
Rule of thumb: OEE is the best single-number metric for the utilization of a specific, capital-intensive or bottleneck piece of equipment. For a flow, human-effectiveness or portfolio-level question it does not replace the appropriate tool but complements it.
Take it home (keys)
Section titled “Take it home (keys)”- One number, three loss families. OEE = A × P × Q; because it is a product, the weakest factor drags the whole thing down.
- One machine = one interpretable OEE. The metric is strongest at the level of the bottleneck and the expensive asset; broadened out, it “flattens.”
- The measurement scope decides. The same FCC is 81% (pilot) or 77.9% (full time breakdown) depending on what you take into the model; this is why the definitions must be fixed in advance.
- The data is born on the gemba, not in Excel: without event-level downtime and loss codes, OEE does not act.
- There is no magic target number. What counts is the improving trend measured against your own baseline, not the roughly 85% “world-class” commonplace.
- OEE is a tool, not a trophy: it is raised by kaizen + PDCA aimed at the biggest loss line, not by loosening the plan.
Self-test
Section titled “Self-test”Calculate the annual OEE of a unit from the (illustrative) data below, then check yourself against the answer key.
- Availability: 279 days
- Scheduled production time: 365 days
- Total produced amount: 268,121.9 tonnes
- Max. producible amount during the available time: 292,950 tonnes
- Quality: 100%
- What is the Availability (A)?
- What is the Performance (P) and the Quality (Q)?
- What is the OEE, and which factor drags it down the most?
Answer key
- A = 279 / 365 = 76.4%
- P = 268,121.9 / 292,950 = 91.5%, Q = 100%
- OEE = 0.764 × 0.915 × 1.00 = 69.9%. The biggest loss is availability (86 days lost), so the stoppages are what to attack first.
How does it appear in digital practice?
Section titled “How does it appear in digital practice?”The three factors of OEE can only be calculated reliably if the data is created at event level, in real time, not from an end-of-month estimate. The same principle that gemba data collection dictates is realized in software today as well, in any well-organized production data environment: the mechanism differs, the principle is the same.
| OEE element | Digital implementation | What it delivers |
|---|---|---|
| Availability — downtime and changeover time | automatic downtime collection with a timestamp, downtime cause code | availability from raw data, not from an estimate |
| Performance — speed loss, minor stop | continuous comparison of production rate vs. rated capacity | slow running and minor stops become visible automatically |
| Quality — scrap, rework | structured recording of quality objections and off-spec batches | the Q loss can be broken down by source |
| Loss ranking | automatic OEE calculation, trend, Pareto on the loss causes | the biggest loss line surfaces by itself |
Connection to OPEREX (shift log)
Section titled “Connection to OPEREX (shift log)”The three components of OEE can only be calculated reliably if the stoppages, speed losses and quality events are recorded in a structured way, at event level, during the shift — exactly the kind of data the OPEREX shift log collects. The downtime cause code, changeover (C/O) time and quality objection extracted from the log feed the Availability / Performance / Quality breakdown directly, and replace the after-the-fact, Excel-based estimate. This way OEE is not an end-of-month look back but a live, auditable metric from shift to shift.
Terminology (HU / EN / JP)
Section titled “Terminology (HU / EN / JP)”| Hungarian | English | Japanese / note |
|---|---|---|
| Teljes berendezés-hatékonyság | Overall Equipment Effectiveness (OEE) | the classic TPM metric (Nakajima) |
| Rendelkezésre állás | Availability | downtime + changeover loss |
| Teljesítmény | Performance / Performance efficiency | minor stop + speed loss |
| Minőség | Quality | scrap + rework |
| Leállás | Downtime / Breakdown | — |
| Átállás | Changeover (C/O) | reduction: SMED |
| Sebességveszteség | Speed loss / Speedloss | — |
| Mikroleállás | Minor / micro stop | — |
| Selejt / utómunka | Scrap / rework | — |
| Szűk keresztmetszet | Bottleneck | the primary target of OEE |
| Hat nagy veszteség | Six big losses | TPM framework, 3 factors × 2 losses |
What is OEE and how do you calculate it?
OEE (Overall Equipment Effectiveness) measures how well a piece of equipment runs compared to the theoretical maximum. It is the product of three factors: OEE = Availability × Performance × Quality, where Availability covers downtime and changeover loss, Performance covers speed loss and minor stops, and Quality covers scrap and rework.
What is the exact formula of the three OEE components?
Availability = (available time − downtime) / available time. Performance = (operating time − speed losses) / operating time, i.e. actual produced amount / theoretical max capacity. Quality = (processed − defects) / processed, i.e. good amount / total produced amount.
When is it worth measuring OEE, and when not?
When there is a concrete business reason: typically at a bottleneck machine or at high capital cost equipment where utilization must be raised. Pulling a single OEE number for a whole site, on the other hand, is misleading: the broader the scope, the less usable it is for generating improvement ideas.
What is a good OEE in a process-industry plant?
In the processed material, the OEE of an FCC unit was 77.9% in 2013 in the full time breakdown (A = 83.8%, PE = 93%, Q = 100%); an earlier, 2012 pilot on the same unit gave 81%. The difference comes from the measurement scope and the time model. The processed material gives no fixed industry target number; what counts is the improving trend measured against your own baseline.
Why does it matter that OEE is a product?
Because the three factors are multiplicative: if any one of them (e.g. quality) is weak, it degrades the total OEE disproportionately, so all three dimensions must be improved at once. Root-cause problem solving leads at the same time to higher OEE, higher productivity and a motivated workforce.
Related concepts
Section titled “Related concepts”vsm · smed · 5S · kaizen · pdca · jidoka · andon · tpm · KPI definition · standard work · performance board
Next step
Section titled “Next step”If you have understood this, from here it is worth going on — in this order:
- TPM — the framework from which OEE and the six big losses come; the systematic raising of equipment reliability.
- SMED — the availability loss you can attack fastest: the radical shortening of changeover time.
- performance board — how to make OEE and the loss ranking the subject of the daily/weekly performance dialogue (MOS).
References / further reading
Section titled “References / further reading”- Seiichi Nakajima: Introduction to TPM: Total Productive Maintenance. Productivity Press, 1988 — the conceptual origin of OEE and the “six big losses,” the canonical foundational work of TPM.
- Seiichi Nakajima: TPM Development Program: Implementing Total Productive Maintenance. Productivity Press, 1989 — the detailed handbook of OEE-based loss analysis and implementation.
- Robert C. Hansen: Overall Equipment Effectiveness: A Powerful Production/Maintenance Tool for Increased Profits. Industrial Press, 2001 — the practical reference for applying OEE in continuous (process industry) operation.