Reliability KPIs
≈ 12 min read · 2,346 words
Reliability KPIs show whether reliability goals are met: MTBF measures reliability, MTTR maintainability, availability A = MTBF/(MTBF+MTTR) joins them.
A KPI is not an objective but an indicator of whether the objective is met, and there are two kinds of it: the leading indicator, which you can influence today, and the lagging indicator, which shows the past result. Management has to work with few indicators, aligned to the objectives.
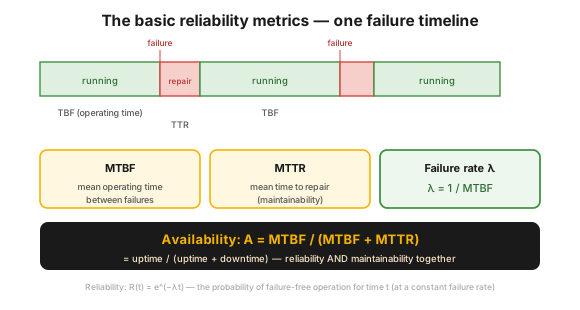 Figure 1 — the basic reliability metrics on one failure timeline.
Two questions decide how reliable a piece of equipment is: how many times it breaks down, and how long it stands still. MTBF answers the first, MTTR the second.
Who is this for?
Section titled “Who is this for?”This article is for those who make decisions from reliability numbers, or who are measured by them: plant manager · process engineer · shift supervisor · reliability engineer · maintenance planner · controlling.
Learning objectives
Section titled “Learning objectives”After reading this article you will be able to:
- calculate availability from MTBF and MTTR;
- distinguish the levels of availability (MA, OA, OSF), and classify a downtime event;
- decide on the basis of two rules whether an indicator is a leading one;
- recognize when MTBF misleads, and what to use instead.
In brief
Section titled “In brief”- MTBF: the mean operating time between two failures. MTTR: the mean, pure repair time; MDT also includes the waiting.
- Failure rate: λ = 1 / MTBF; reliability is R(t) = e^(−λt).
- The levels of availability: mechanical (MA) ≥ operational (OA) ≥ on-stream factor (OSF).
- A KPI is not a goal but an indicator: it has to be aligned to the objective (V-diagram).
- Leading vs. lagging: the leading indicator is the “how,” the lagging one the “what.” You need both.
- Typical targets: schedule compliance above 90–95%, PM compliance ≥ 95%, reactive work < 20%.
Why it matters (the stakes)
Section titled “Why it matters (the stakes)”The reliability indicator decides where the maintenance money goes: with the wrong indicator the organization spends on what is louder, not on what is more expensive. The indicators also shape behaviour patterns: if management only asks for numbers that measure the past, the program chases the past.
The KPI as an indicator, not an objective
Section titled “The KPI as an indicator, not an objective”A KPI is not an objective but an indicator of the objective being met: the objectives are cascaded on the left-hand side of the V-diagram, and the KPIs verify them on the right-hand side. Key performance indicators measure those few, typically 4–5 factors that are needed for success at the strategic level. If an indicator does not lead to action, it becomes a useless exercise (KPI basics).
What are the main reliability KPIs?
Section titled “What are the main reliability KPIs?”There are four basic metrics: MTBF measures the mean operating time between failures, MTTR the mean repair time, the failure rate (λ) the frequency of failures, and availability (A) the resultant of the two.
- MTBF (Mean Time Between Failures): the measure of reliability. It applies to repairable assets, because it also contains the repair time; for non-repairable ones its counterpart is MTTF (mean time to failure).
- MTTR (Mean Time To Repair): the measure of maintainability, the pure repair time (wrench time). Together with the waiting delays, MDT (mean down time) is the correct indicator.
- Failure rate (λ): at a constant failure rate λ = 1 / MTBF, which is characteristic of the “flat” section of the bathtub curve; reliability is then R(t) = e^(−λt), the probability of failure-free operation for a time t.
- Availability (A): measures the two together:
A = MTBF / (MTBF + MTTR) = operating time / (operating time + downtime)
The same availability can be reached with rare, long or with frequent, short downtime, which is why MTBF and MTTR are needed together (Design for Reliability). At asset level, inherent availability counts only the repair, the operational one the waiting as well; this is not the same as the plant-level OA below.
The levels of availability
Section titled “The levels of availability”In the process industry availability is measured at nested levels: the mechanical one (MA) deducts only the mechanical downtime, the operational one (OA) the process and regulatory downtime too, and the on-stream factor (OSF) the other causes as well.
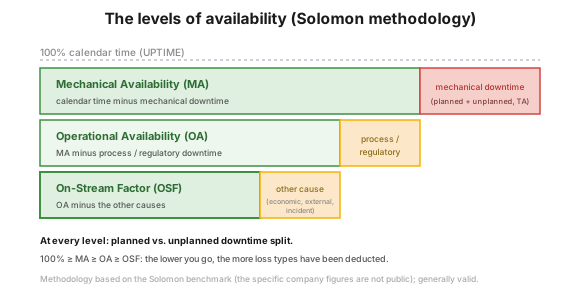 Figure 2 — the nested levels of availability (Solomon methodology).
The benchmark methodology classifies the losses with a code table; the specific company figures are not public, but the methodology is generally valid:
- MA: calendar time minus the mechanical downtime (planned turnaround/TA, rotating equipment, static equipment, instrumentation and electrical failure).
- OA: MA minus the process and regulatory downtime (catalyst regeneration and change, furnace cleaning, regulatory inspection, operator error).
- OSF: OA minus the other causes: economic, external, plant incident, off-site incident, other. It is instructive that a loss caused by an incident falls here, not into MA.
The relation: 100% ≥ MA ≥ OA ≥ OSF. At every level the planned vs. unplanned split matters: unplanned (reactive) downtime is the main target of the program. A separate loss type is the partial rate reduction (slowdown), which is measured separately from the full stop (shutdown). The annual expected (AE) value calculates for one year (8760 hours) and is a plan value; the monthly or year-to-date (YTD) figure is an actual value, and the two are not comparable.
What is the difference between a leading and a lagging indicator?
Section titled “What is the difference between a leading and a lagging indicator?”The lagging indicator is the “what”: it describes the result that has already happened. The leading indicator is the “how”: it measures the direction of performance before the result takes shape, and so allows an earlier intervention.
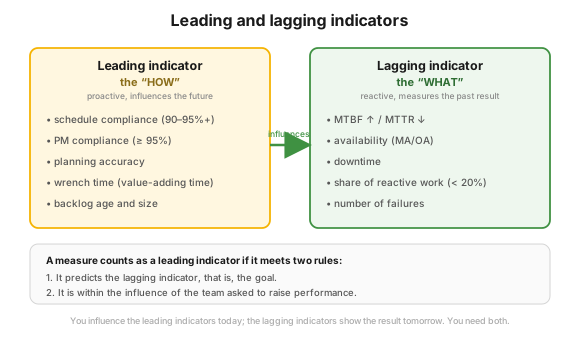 Figure 3 — you influence the leading indicators today; the lagging indicators show the result tomorrow.
A measurement counts as a leading indicator if it meets two rules:
- It predicts the lagging indicator, that is, the goal.
- It is within the influence of the team asked to raise performance.
- Leading examples: schedule compliance, PM compliance, planning accuracy, wrench time, backlog age.
- Lagging examples: MTBF, MTTR, availability, downtime, share of reactive work, number of failures.
The two are cause and effect: good leading indicators improve the lagging ones over time. The framework is set out in KPI basics.
The maintenance and reliability KPI set
Section titled “The maintenance and reliability KPI set”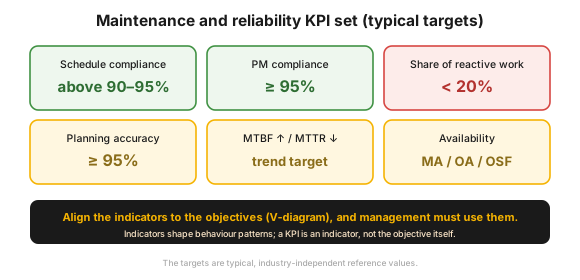 Figure 4 — typical, industry-independent targets.
The targets established in maintenance and reliability practice:
- Schedule compliance: depending on maturity, above 90–95% (maintenance planning and scheduling).
- PM compliance ≥ 95%: the preventive tasks done on time (preventive maintenance).
- PM planning accuracy ≥ 95%: the deviation between the estimated and the actual hours.
- Reactive work < 20%: the reactive component of the 20/40/40 work split.
- MTBF ↑ / MTTR ↓: trend targets. Availability (MA/OA/OSF): the output indicator, and at the same time one of the factors of OEE.
The indicators shape behaviour patterns: a bad indicator encourages bad behaviour.
Common mistakes
Section titled “Common mistakes”- Taking the KPI for the objective: the KPI is an indicator, the goal is the objective.
- Only lagging indicators: the program chases the past.
- Availability as a single number: MTBF and MTTR together tell the whole story.
- Uncalibrated definitions: what counts as downtime, and whether we compare a plan or an actual value.
- An indicator without a goal: tie the KPI to the objective hierarchy (V-diagram).
- “Let it improve” as a target: “2% better than last year” carries hardly any meaning in a strategic sense. An easily reached target brings a slight improvement, an impossible one takes away the motivation.
- A manipulable indicator: a bad incentive breeds bad behaviour.
When NOT to use it (the limits of the method)
Section titled “When NOT to use it (the limits of the method)”Reliability KPIs measure but do not explain; the simplicity of MTBF is tempting, but it also misleads.
| Situation | Why the KPI is not enough | The right answer |
|---|---|---|
| You would set the preventive interval from MTBF | there is a high risk that the failure occurs before the intervention | life distribution, Design for Reliability |
| The failure rate is not constant (burn-in, wear-out) | λ = 1/MTBF holds only on the flat section | bathtub curve, distribution fitting |
| A unique, non-repairable part | MTBF also contains the repair time | MTTF |
| You are looking for the cause behind the number | the KPI signals a deviation, not an explanation | root cause analysis, fmea |
Rule of thumb: MTBF is suitable for signalling performance but weak as a basis for decisions; the behaviour of the asset is described more faithfully by R(t).
Industrial and safety context
Section titled “Industrial and safety context”Reliability KPIs are industry-independent, but in the process industry the share of unplanned downtime is directly linked to safety: fewer unplanned trips and a longer MTBF mean fewer hazardous start-ups and shutdowns.
Putting it into practice (roadmap)
Section titled “Putting it into practice (roadmap)”- Tie the KPIs to the objectives (V-diagram), and choose 4–5 balanced indicators.
- Define uniformly the levels of availability and the downtime categories.
- Start with the maintenance basics: schedule compliance, PM compliance, share of reactive work.
- Measure both leading and lagging indicators.
- Set a stretching but attainable target with an owner.
- Have management use the indicators, otherwise they remain data, not steering.
Hands-on
Section titled “Hands-on”- Calculate the availability of a pump: 3 failures during 8760 operating hours, with 6 hours of repair in total. What are MTBF, MTTR and A?
- Classify five downtime events of last year at MA, OA or OSF level, and mark whether they were planned. Wherever you argue, a calibrated definition is missing.
Take it home (keys)
Section titled “Take it home (keys)”- Ask for two numbers, not one. MTBF and MTTR separately tell you whether you stand rarely-and-long or frequently-and-briefly.
- Quote the indicator together with its level. An “availability” figure without MA/OA/OSF is not comparable, and neither are a plan and an actual value.
- Two rules decide whether an indicator is leading: it predicts the goal, and the team can influence it.
- MTBF should not be the basis of an interval: the mean is not the most likely time to failure.
- Every indicator should have a target and an owner.
Self-test
Section titled “Self-test”- A piece of equipment has an MTBF of 2920 hours and an MTTR of 8 hours. What is its availability?
- A loss was caused by an off-site incident. At which level does it appear, and which one does it not worsen?
- The shift’s wrench time is 32%. Is this a leading or a lagging indicator, and why?
Answer key: 1) A = 2920 / (2920 + 8) = 99.7%. · 2) In the OSF; it does not worsen MA and OA, because the “other” causes are deducted only from the on-stream factor. · 3) Leading: it meets both rules.
How does this show up in digital practice?
Section titled “How does this show up in digital practice?”A reliability indicator does not become good from the monthly data pull, but from the data being created where the event happens.
| KPI element | Digital implementation | What it delivers |
|---|---|---|
| Failure (MTBF) | work order tied to the asset register, with a failure code | asset-level MTBF without a separate data collection |
| Start and end of repair (MTTR, MDT) | work-order timestamps, waiting statuses | the repair is separated from the waiting |
| Classifying downtime (MA/OA/OSF) | event register with category fields | a calibrated, comparable indicator |
| Leading indicators | automatic calculation of schedule and PM compliance | the intervention happens within the week |
| A condition signal before the failure | condition-based (PdM) alarm, digital operator round | the improvement is caused, not accidental |
Connection to OPEREX (shift log)
Section titled “Connection to OPEREX (shift log)”The raw material of the reliability KPIs is the shift event. The mandatory fields of the event register are exactly those the shift log (OPEREX) has to record: event identifier, causing unit, affected unit, causing equipment, event description, loss classification, the start and end of the event, and the slowdown and shutdown durations. This way the KPIs can be calculated from the daily log, in near real time.
Terminology (HU / EN)
Section titled “Terminology (HU / EN)”| Hungarian | English (canonical) | Note |
|---|---|---|
| Átlagos működési idő hibák között / meghibásodásig | Mean Time Between Failures (MTBF) / To Failure (MTTF) | for repairable / non-repairable assets |
| Átlagos javítási idő / átlagos állásidő | Mean Time To Repair (MTTR) / Mean Down Time (MDT) | pure repair / repair + waiting |
| Rendelkezésre állás / hibaráta | Availability / failure rate (λ) | A = MTBF/(MTBF+MTTR); λ = 1/MTBF |
| Üzemeltetési rend. állás (eszközszint) | Operational availability | not the same as the plant-level OA |
| Mechanikai / üzemeltetési rend. állás (üzem) | Mechanical / Operational Availability | MA / OA |
| On-stream faktor | On-Stream Factor (OSF) | the strictest level |
| Előre jelző / utólag mérő | Leading / lagging indicator | “how” / “what” |
What are MTBF and MTTR, and how do they turn into availability?
MTBF is the mean operating time between two failures (reliability), MTTR the mean pure repair time (maintainability). Availability is A = MTBF / (MTBF + MTTR); if the waiting is included, calculate with MDT instead of MTTR.
What is the difference between a leading and a lagging indicator?
The leading indicator is the “how”: it can be influenced today, and it predicts the goal (e.g. PM compliance). The lagging one is the “what”: it measures the past result (e.g. MTBF, downtime).
Why is MTBF not good for setting the maintenance interval?
Because MTBF is a mean, not the most likely time to failure. Depending on the life distribution, the mean may fall well after the most likely time to failure; in that case the preventive intervention is late, and the failure occurs earlier.
What are MA, OA and OSF?
The nested levels of availability: the mechanical one deducts only the mechanical downtime, the operational one the process and regulatory downtime too, and the on-stream factor the other causes as well. 100% ≥ MA ≥ OA ≥ OSF. Availability is also one of the factors of OEE.
Related concepts
Section titled “Related concepts”asset management (ISO 55000) | OEE | wrench time | preventive maintenance | maintenance planning and scheduling | bathtub curve | Design for Reliability | criticality analysis | the long-term reliability program | performance management | KPI basics
Next step
Section titled “Next step”- KPI basics — the general rules of choosing indicators.
- asset management (ISO 55000) — deriving the indicator from the objective hierarchy.
- the long-term reliability program — the annual program steered by the indicators.
References / further reading
Section titled “References / further reading”- ISO 55000:2014 — Asset management. The objective hierarchy the indicators have to be tied to.
- Eduardo Calixto: Gas and Oil Reliability Engineering. Elsevier, 2016 — availability concepts, MTTF vs. MTBF, pitfalls.
- OGP Report No. 456 — Recommended Practice on Key Performance Indicators (2011): the leading/lagging framework.
- API RP 754 — Process Safety Performance Indicators: the indicator pyramid.
- Solomon Associates benchmark methodology — the definition of MA, OA and OSF.
- OREDA (Offshore and Onshore Reliability Data) — failure rate and repair time data.