Financial metrics and ROCE
≈ 18 min read · 3,626 words
Two neighbours each earn the same one million forints a year on their savings. One tied up five million to do it, the other fifty million. The same profit, yet it is obvious which of them manages well: profit only means something once you write next to it how much capital stood behind it. Let’s look at what ROCE means, how you calculate it, and how it breaks down into operating KPIs.
ROCE (return on capital employed) measures operating profit against the capital tied up to earn it: ROCE = EBIT / capital employed. Capital employed, in the usual operating reading, is total assets minus current liabilities. Value is created when ROCE exceeds the pre-tax cost of capital. Being a ratio, it moves only two ways: a bigger result, or less capital employed.
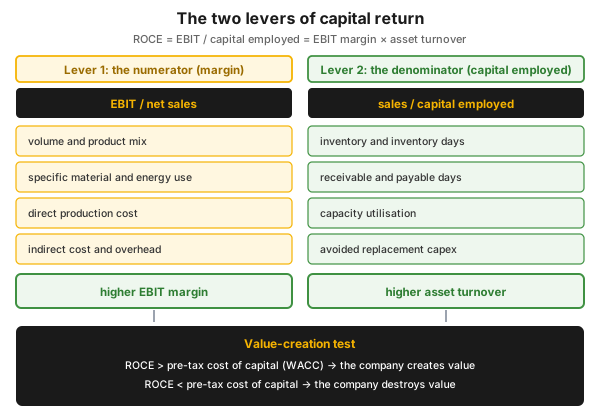
Figure 1 — the two levers of capital return. The product-form derivation: sales cancels out.
Who is this for?
Section titled “Who is this for?”Plants and projects are mini-companies, and their managers compete for funding. This article is for anyone who is not a finance person but decides about money: plant manager · shift supervisor · process engineer · maintenance manager · investment and project engineer · Lean/CI coordinator · controller partner.
Learning objectives
Section titled “Learning objectives”After reading this article you will be able to:
- say what the four metric families measure, and which margin to use when;
- calculate ROCE with the correct denominator, distinguishing the ROOC, ROACE, ROIC and ROS variants;
- run the value-creation test, and draw the value driver tree down to your own KPIs;
- say when this is NOT the right metric.
In brief
Section titled “In brief”- Financial metrics fall into four families: liquidity, profitability, activity (turnover), leverage.
- ROCE = EBIT / capital employed (total assets minus current liabilities).
- Value creation: ROCE is above the pre-tax cost of capital; the metric can be moved two ways, on the margin side or the capital side.
- ROCE measures at book value, so it does not rank plants of different asset age.
- The financial goal is a consequence: set the target on the process indicator, not on the metric.
Why isn’t announcing a profit enough?
Section titled “Why isn’t announcing a profit enough?”Because profit on its own cannot be judged. A large infrastructure company announced four hundred million euros of profit in 1999: is that good or bad? The answer does not come from the number, but from how much capital stood behind it, and what was expected of that capital.
What do financial metrics measure? The four families
Section titled “What do financial metrics measure? The four families”A financial metric is a ratio: it divides two lines of the accounts, so its meaning rides on the denominator.
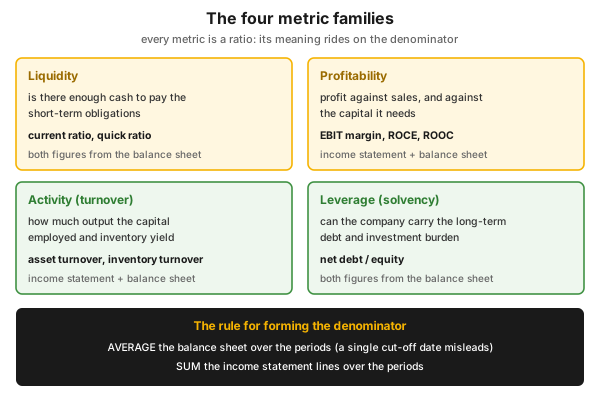
Figure 2 — the four metric families and the rule for forming the denominator.
| Family | What it measures | Typical metric |
|---|---|---|
| Liquidity | is there enough cash for the short-term obligations | current ratio, quick ratio |
| Profitability | the result against sales, and against capital | EBIT margin, ROCE, ROOC |
| Activity (turnover) | how much output the assets and inventory yield | asset turnover, inventory turnover |
| Leverage | can it bear the long-term debt | net debt / equity |
By the traditional rule of thumb a current ratio (current assets / current liabilities) around 2 is considered safe and below 1 signals a payment problem, but the real threshold is industry- and business-model-specific (the three financial statements).
How do you read the margin ladder?
Section titled “How do you read the margin ladder?”The margins all project onto net sales; only the numerator slides down.
| Ratio | Numerator | When it is the right one |
|---|---|---|
| Value-added ratio | sales minus raw material | the weight of the raw material |
| Contribution ratio | sales minus variable cost | product and loading decisions |
| EBITDA margin | EBITDA | large asset base, BETWEEN industries |
| EBIT margin (ROS) | EBIT, the operating result | WITHIN an industry, for improvement over time |
| EBT / sales | pre-tax result | different tax jurisdictions |
The link to the spine of this article: EBIT carries over into the capital-based metrics; ROCE and ROOC use the same figure, only they add capital employed. The breakdown also shows where the handle is: a high wage ratio justifies a productivity improvement (wrench time, standard work), a high material ratio a yield improvement (muda), and a high indirect ratio the administrative processes (cost structure and contribution margin).
What is asset turnover, and what does it say about capital efficiency?
Section titled “What is asset turnover, and what does it say about capital efficiency?”Asset turnover = sales / capital employed: how well the company uses its assets; a high value may signal that it is running near capacity. In a machine-intensive environment the net fixed assets / sales ratio is the more telling one, which an OEE improvement indirectly improves: the capacity squeezed out of the existing machine can make a replacement investment unnecessary.
Inventory turnover is used in two forms: in turns (cost of goods sold / inventory) and in days (inventory × 365 / cost of goods sold); through a Lean lens, high turns and low inventory days are the desirable ones. The aggregates are carried through by working capital and the cash conversion cycle.
What is ROCE, and how do you calculate it?
Section titled “What is ROCE, and how do you calculate it?”ROCE = EBIT / capital employed, where capital employed = total assets minus current liabilities; this is the most widespread operating reading.
Two things decide whether your figure is valid. One: the balance sheet must be averaged over the periods examined and the income statement summed, otherwise a machine bought in July throws off the analysis (hence the “average” in ROACE). Two: there are several variants of the metric, with different denominators.
| Variant | Formula |
|---|---|
| ROCE (canonical) | EBIT / capital employed |
| ROOC | EBIT / operating capital (without cash and tax liability) |
| ROACE | annual RCOP (result at replacement cost) / two-year average capital employed |
| ROIC | EBITA / invested capital |
| ROS | EBIT / sales (margin side, without capital) |
Return on equity (ROE) is deliberately not in the table: it is an owner’s view, not EBIT-based, so it is not interchangeable with these.
The leitmotif is the product form: expanded with sales, ROCE = (EBIT / sales) × (sales / capital employed), that is, EBIT margin × asset turnover. Not a separate metric, but the same ratio split into two factors — and to an engineer’s eye this is the most useful form: it shows that the metric can be moved from two directions.
When does a company create value?
Section titled “When does a company create value?”When ROCE exceeds the pre-tax cost of capital. This is what turns the metric into a decision; the profit goal is the same thing put differently: maximise the result above the cost of the invested capital.
The threshold is the weighted average cost of capital (WACC): the minimum return that must be earned on the existing asset base to serve the lenders and the owners (working capital and the cash conversion cycle). In investment appraisal the same thing is called the hurdle rate, the minimum accepted internal rate of return. There is no single corporate standard for it: some calculations use the target ROCE as the WACC, so the threshold is fixed by the organisation.
Why is ROCE unfair between two plants?
Section titled “Why is ROCE unfair between two plants?”Because it measures at book value: a plant with a largely written-off asset base yields a higher ROCE than a newer, even technically better plant.
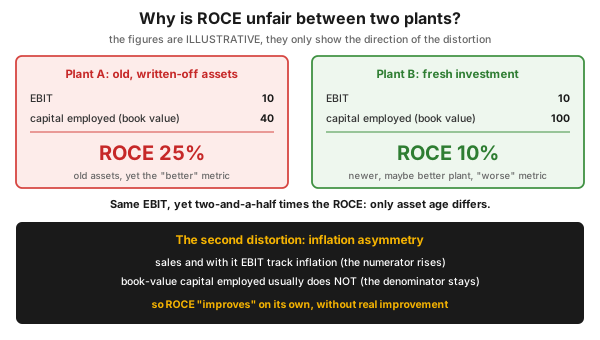
Figure 3 — the book-value trap and the inflation asymmetry. The figures are illustrative.
The second distortion is inflation: sales follow the price level, book-value capital employed generally does not, so the metric “improves” on its own. The third limit is in investment appraisal: ROACE does not handle the timing of cash flows, and it works with financial rather than cash-flow data; its strength is easy computation.
How does the financial goal break down into an operating KPI?
Section titled “How does the financial goal break down into an operating KPI?”With a value driver tree: the root is capital return, two main branches (margin and capital employed), four intermediate drivers (sales, cost, working capital, fixed capital), and the leaves are your KPIs.
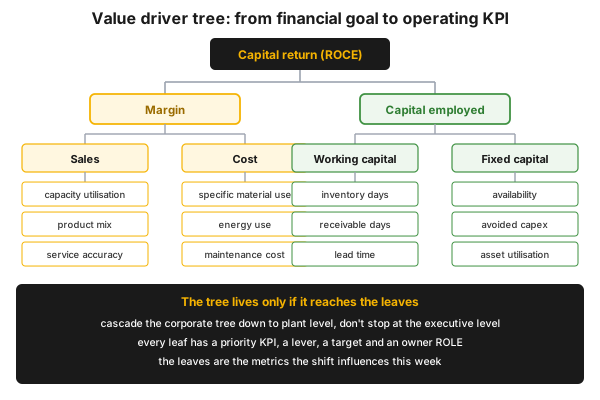
Figure 4 — the value driver tree on four levels, from the financial root to the operating KPI.
The proven protocol from a large-company transformation programme:
- Corporate value driver tree cascaded down to plant level.
- Priority KPIs, levers and targets for EVERY role.
- Populate the tree at site level, then run a lever analysis on the priority levers.
- Idea generation, value/ease ranking, idea charter, business-case KPI tracking.
The tree comes alive when it is built into the operating system: the KPI cascade follows OGSM, with the value driver trees below it, while the tree and the benefit tracking live in the meeting rhythm of the MOS and in the performance dialogue.
Which operating KPI moves which metric?
Section titled “Which operating KPI moves which metric?”The mapping is teachable. The percentages are planning magnitudes, not guarantees: your own figure comes from your own baseline.
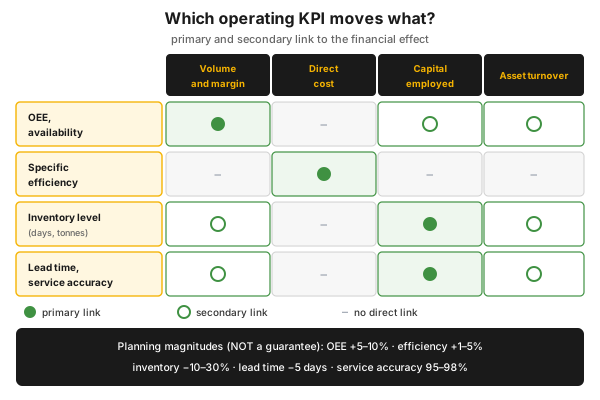
Figure 5 — KPI and financial effect with primary and secondary links. The strength ranking of the links is this article’s own mapping.
| Operating KPI | Financial effect | Magnitude |
|---|---|---|
| OEE, availability | more volume and margin; secondarily better asset turnover | +5–10% |
| Specific efficiency | saving on the direct production cost | +1–5% |
| Inventory level | lower cost of capital, one-off cash, less working capital, better turnover | −10–30% |
| Lead time | less safety stock, secondarily more sales | −5 days |
| Service accuracy (OTIF) | less buffer stock, better customer value | 95–98% |
Inventory is an especially strong lever because it works through three channels: financing cost falls, one-off cash is freed by selling the excess, and turnover improves.
Worked example: how does the metric move from an improvement package?
Section titled “Worked example: how does the metric move from an improvement package?”The annual Lean potential of a process-industry plant came out like this (million euros, on the basis of the last twelve months):
| Metric | Before | After | Change |
|---|---|---|---|
| Operating revenue | 180.8 | 197.1 | +16.3 |
| Operating cost | 139.5 | 146.7 | +7.2 |
| EBITDA | 41.3 | 50.4 | +9.1 |
| EBITDA margin | 22.8% | 25.5% | +2.7 percentage points |
Two drivers produced it: +36,000 tonnes of volume increase (in sales and production at once) and 2.3 million euros of efficiency saving. That is also why the cost line rises: the larger volume brings sales AND variable cost, while efficiency, by contrast, cuts. The lesson: EBITDA is lifted by both volume AND cost cutting, but the MARGIN mainly by cost cutting. One percentage point of margin is worth 1,808 thousand euros on the starting base and 1,971 thousand euros on the improved base.
What does this mean in the process industry?
Section titled “What does this mean in the process industry?”In a capital-intensive plant the denominator dominates. In assembly manufacturing, labour is about 70% of the production cost and capital plus material 30%; in the process industry this is reversed, with 30% labour and 70% capital and material. That is why process-industry Lean concentrates on the asset side: an improvement on the turnover side often brings more than one on the margin side.
The order of magnitude comes from public benchmarks: from the industry average to the top quartile, the delta is 20% lower operating cost, 10% higher utilisation rate, 4% better maintenance availability and 30% lower energy use (API, Solomon, OSHA, IHS Markit databases).
A published case: an organisation achieved a 60% capacity increase in such a way that the new investment was smaller than the depreciation (“negative net investment”), so profit and capital return improved at once.
Two accounting peculiarities also raise the denominator: the technological minimum stock of pipelines and tanks (line fill) and the cushion gas are part of the fixed assets. The cost of a turnaround is also capitalised, so it enters the balance sheet: a postponed turnaround keeps the denominator lower in the short term.
What do you see of this in the management report?
Section titled “What do you see of this in the management report?”The capital-based metrics sit at the top of the report, not on the daily board: ROCE makes sense in a monthly, quarterly and annual rhythm. Three lines carry the logic of this article.
| Line in the report | Rhythm | Denominator to write out |
|---|---|---|
| EBIT margin (ROS) | month and cumulative | net sales |
| Asset turnover | quarter, year | averaged capital employed |
| ROCE, ROOC, ROACE | quarter, year | averaged capital employed / operating capital |
What belongs in the weekly rhythm is not the metric but the value driver tree, the priority KPIs and the benefit tracker; the financial line is what these precipitate into (the performance board).
Introduction in practice
Section titled “Introduction in practice”- Ask for your unit’s EBIT and the balance-sheet lines that go with it.
- Calculate ROCE with an averaged balance sheet and summed result lines, and record in writing the formula and the content of the denominator.
- Draw up the value driver tree down to your own KPIs, with the responsible role at every leaf.
- Pick the two or three biggest levers by value and ease, and calculate the effect on BOTH sides, on margin and on capital employed.
- Take the lever onto the performance board, and have the owner named in the performance dialogue.
Hands-on: draw your own value driver tree
Section titled “Hands-on: draw your own value driver tree”A ninety-minute workshop, 4–6 people, one flipchart. Put capital return with its formula in the middle, and have everyone say what they mean by capital employed (10 minutes). Two main branches, four intermediate drivers (10 minutes). Everyone fits in their own KPIs; anything that fits nowhere has no financial pathway (25 minutes). Levers onto a value/ease matrix (20 minutes). Compute the best candidate through to the end (25 minutes).
Homework: write down the effect of your latest proposal in two lines, on the margin side and the turnover side.
Measurement and audit: the metric definition sheet
Section titled “Measurement and audit: the metric definition sheet”A metric is auditable if its definition exists in writing; three lines are enough (the financial case of the KPI definition sheet).
| Element | What to record |
|---|---|
| Metric and formula | the variant too (ROCE, ROOC, ROACE, ROIC), with the exact formula |
| Source of numerator and denominator | which result line (EBIT, EBITA), which balance-sheet lines, with what averaging |
| Period and owner | month, quarter, year; and who influences it this week |
Common mistakes
Section titled “Common mistakes”- A single cut-off-date denominator. Why it’s a problem: an asset capitalised mid-year throws off the analysis. Instead: averaged balance sheet, summed income statement.
- Blending margin and turnover. Why it’s a problem: behind “our margin is good” there may be a capital-wasting asset base. Instead: state both factors.
- Ranking between plants of different asset age. Why it’s a problem: because of book value the older plant wins. Instead: compare with technical and specific metrics, use ROCE for trends.
- Setting the financial metric as a target. Why it’s a problem: ROCE cannot be driven directly. Instead: set a quantified target on the process indicators (lead time, service speed, rework, defect count); the financial goal is their consequence.
- The benefit is not tied to the planning process. Why it’s a problem: the improvement does not show up in a single plan line, so it did not really happen. Instead: benefit tracking with the business-case KPIs.
When NOT to use it (the limits)
Section titled “When NOT to use it (the limits)”| Situation | Why it is not this metric | The right answer |
|---|---|---|
| Shift-level daily decision | it is of monthly-annual rhythm | the performance board, KPIs, PIs and indicators |
| Investment appraisal | it does not handle the timing of cash flows | net present value, internal rate of return, discounted payback, capital efficiency (NPV / present value of the investment), netback price |
| Ranking plants of different asset age | book value distorts | technical and specific metrics |
| Product or loading decision | it is not product-level | contribution margin (cost structure and contribution margin, profit per hour) |
| Safety or environmental investment | it is not a question of return but of obligation | risk-based ranking, asset management (ISO 55000) |
Rule of thumb: a single metric never decides. Capital return tells you whether it is worth tying up capital here; it does not tell you what to do on the shift tomorrow.
Take it home (keys)
Section titled “Take it home (keys)”- Write out the formula and the denominator, and use the same one on both sides you compare.
- Calculate with an averaged balance sheet and a summed income statement.
- Ask at every proposal: does it move the margin or the capital? And where does the freed capital go?
Self-test
Section titled “Self-test”- EBIT 15, average total assets 120, average current liabilities 40. What is the ROCE, and does it create value at a 9% cost of capital?
- On which branch of the value driver tree does an inventory reduction act, and through how many channels does it precipitate into money?
- Why can a plant with a written-off asset base yield a higher ROCE than a newer one, and what do you use instead?
Answer key: 1) 120 − 40 = 80, ROCE = 15 / 80 = 18.75%, above the 9%: it creates value. · 2) On the capital-employed branch, through working capital, on three channels. · 3) Because the denominator is at book value: the written-off asset is less capital for the same EBIT; instead, use technical and specific metrics.
How does it show up in digital practice?
Section titled “How does it show up in digital practice?”The principle of breaking a metric down does not stop at the flipchart: the same thing is realised in software too.
| The metric-breakdown principle | Digital implementation | What it prevents, what it delivers |
|---|---|---|
| One metric, one definition | the formula and the denominator in one authoritative place, versioned | there won’t be a different ROCE per department |
| The data comes from the plant | automatic collection: volume, downtime, specific consumption, inventory movement | the effect is not from an estimate |
| The tree reaches down to the leaves | a tree-view dashboard with priority KPIs, benefit tracking with an audit trail | everyone sees which branch is theirs |
Connection to OPEREX (shift log)
Section titled “Connection to OPEREX (shift log)”The raw material of the bottom level of the tree is the record generated shift by shift: downtime and its cause, off-spec quantity, inventory movement, specific consumption, labour hours. In a digital shift log (OPEREX) these are retrievable, so the movement of the metric is auditable after the fact.
Terminology (HU / EN)
Section titled “Terminology (HU / EN)”| Hungarian | English (canonical) | Note |
|---|---|---|
| lekötött tőke | capital employed | total assets minus current liabilities |
| működési tőke | operating capital | the denominator of ROOC |
| lekötött tőke megtérülése | ROCE (return on capital employed) | EBIT / capital employed |
| befektetett tőke megtérülése | ROIC (return on invested capital) | EBITA / invested capital (core business); ROACE: with a two-year average denominator |
| saját tőke megtérülése | ROE (return on equity) | owner’s view, not EBIT-based |
| üzemi eredmény hányad | ROS (return on sales) | EBIT / sales |
| eszközforgás | asset turnover | sales / capital employed |
| tőkeköltség, megtérülési küszöb | WACC, hurdle rate | minimum required return |
| értékhajtó-fa | value driver tree (VDT) | the breakdown of the metric into operating drivers |
What is ROCE, and what does it mean if it is low?
The ratio of the operating result (EBIT) to capital employed (total assets minus current liabilities). If it is low, the company ties up a lot of capital for little result; below the cost of capital it burns value.
What is the difference between ROCE, ROOC and ROIC?
All three measure the result against capital, with a different denominator: ROCE against total capital employed, ROOC against operating capital (without cash and tax liability), ROIC against the invested capital of the core business. ROACE is the same with a two-year average denominator.
When does a company create value, and which margin should I use for my own area?
When the return on capital employed exceeds the pre-tax cost of capital. The margin choice: within an industry and for improvement over time, EBIT margin; between industries, EBITDA margin; for a loading decision, the contribution ratio.
Why can't the ROCE of two plants be compared?
It is used for comparison, but not for fair ranking: it measures at book value, so a plant with a written-off asset base yields a higher ROCE than a newer one. Inflation also distorts, because sales follow the price level while book-value capital does not.
Related concepts
Section titled “Related concepts”financial vs. management reporting · the three financial statements · cost structure and contribution margin · working capital and the cash conversion cycle · the KPI definition sheet · the KPI cascade · KPIs, PIs and indicators · leading and lagging indicators · the performance board · the performance dialogue · OGSM · MOS · OEE · profit per hour · asset management (ISO 55000) · operational excellence
Next step
Section titled “Next step”- working capital and the cash conversion cycle — pricing the denominator side in days.
- profit per hour — the margin logic in an operating, hourly breakdown.
- KPIs, PIs and indicators — from the leaf of the tree to the control variable the shift can set.
References / further reading
Section titled “References / further reading”- IFRS Foundation / IASB: IFRS Accounting Standards (ifrs.org) — the standards of the reports that supply the numerator and the denominator.
- IAS 1 — Presentation of Financial Statements (IASB) — the classification criterion of a current liability, for the denominator of capital employed.
- Raymond C. Floyd: Liquid Lean — Developing Lean Culture in the Process Industries. Productivity Press, 2010 — the process-industry case and the 70/30 cost-structure ratios.
- Tim Koller, Marc Goedhart, David Wessels: Valuation — Measuring and Managing the Value of Companies. Wiley — the literature on return on invested capital and the value-driver breakdown.