Turning downtime into money
≈ 17 min read · 3,496 words
A pump trips at two in the morning, the crew brings it back within four hours, and by dawn no one talks about it anymore. In the shift log there is one line: “P-101 trip, 4 hours.” In the accounts, though, there is no trace of it — even though those four hours were money just the same, only it does not show. Until you turn the downtime hour into money, reliability always loses out to the visible cost. Let’s look at how you work out the price of one downtime hour, and why you use the lost contribution, not the full product price.
A downtime hour costs the lost contribution: value the lost output at the contribution-based unit rate, not the full product price.
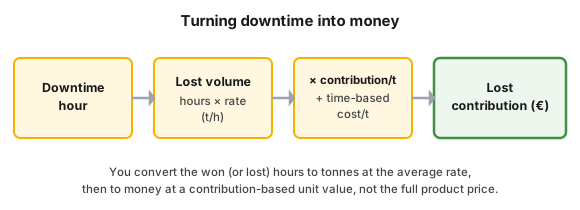
Figure 1 — the chain of turning a downtime hour into money.
Who is this for?
Section titled “Who is this for?”For those to whom availability is the daily reality, and who have to defend a reliability measure with a number: plant manager · process engineer · shift supervisor · reliability engineer · maintenance manager · production planner · controlling partner.
Learning objectives
Section titled “Learning objectives”After reading this article you will be able to:
- calculate the price of one downtime hour in your own plant, from lost tonnes and contribution;
- pick the right cost base: contribution plus time-based direct cost, instead of the full price;
- separate the margin-constrained and the capacity-constrained (sold-out) case, and net off the post-restart catch-up;
- value planned and unplanned loss differently, with the logic of the on-stream factor;
- use the resulting number to rank downtime events and to justify a reliability investment.
In brief
Section titled “In brief”- The price of a downtime hour is the lost contribution, not the full price of the lost product. Fixed cost is incurred during the downtime too, so it does not belong in the loss.
- The formula: lost hours × average rate (t/h) × (contribution/t + time-based direct cost/t).
- Net off the post-restart catch-up: whatever you make up after recovery was not lost.
- In a margin-constrained plant the net loss can be small; in a capacity-constrained, sold-out plant the full loss is permanent.
- Unplanned downtime is more expensive: the planned loss is priced into the on-stream factor, the trip is not.
- The number is not an end in itself: you use it to rank downtime events and to justify the reliability investment.
Why it matters (the stakes)
Section titled “Why it matters (the stakes)”Unmeasured downtime is invisible, and an invisible loss always loses out to the visible cost. If a maintenance intervention means a concrete invoice, while the forgone benefit of a reliability investment is just a log line, then the decision speaks against the investment — even when that is the right decision. This distortion is the real stake: a common pitfall of a plant is that it has hardly any metric for lost production, so reliability is systematically underfunded, because no one can defend it with a number. Pricing the downtime hour removes this: the log line becomes money, and the reliability investment becomes comparable with the visible cost.
What is downtime in money terms, and where does the number come from?
Section titled “What is downtime in money terms, and where does the number come from?”Downtime in money terms is the forgone contribution you did not produce during the outage. You turn the physical loss (fewer running hours, fewer tonnes) into money, and the conversion factor is not the full product price but the contribution: the difference between the net price and the variable costs.
Why the contribution? Because the fixed cost is incurred during the downtime too. Wages, rent, insurance and depreciation are payable even if not a single tonne is made; the downtime does not increase these, so they do not belong in the loss. What the downtime takes away is what, on every tonne produced, would have been left to cover the fixed cost and the profit: the contribution. The full derivation of contribution is in the cost structure and contribution article; here we apply it to downtime. The logic holds for any continuous production where time produces directly (downtime, or cost of downtime).
How do you calculate the price of one downtime hour?
Section titled “How do you calculate the price of one downtime hour?”You calculate the price of one downtime hour as the product of the lost hours, the average production rate and the contribution-based unit value: you convert the lost hours to tonnes, then multiply by the contribution and by the direct cost that runs on during the downtime too. The formula:
lost contribution = lost hours × average rate (t/h) × (contribution/t + time-based direct cost/t)
A worked example for the logic (the numbers are illustrative; your own plant data gives the real value):
| Item | Value (illustrative) |
|---|---|
| Length of downtime | 48 hours |
| Average production rate | 20 t/h |
| Lost volume | 48 × 20 = 960 t |
| Contribution | 150 €/t |
| Time-based direct cost | 40 €/t |
| Lost contribution | 960 × (150 + 40) = 182,400 € |
Two practical handholds for the right number. First: compute the lost volume from the won (or lost) production hours and the average production rate, not from the nominal peak capacity, because the real rate usually falls short of it. Second: reference the loss to a fixed baseline (the approved rolling plan, “Forecast-0”). This way the number stays auditable, and two events become comparable.
How much contribution is lost: which cost do you count?
Section titled “How much contribution is lost: which cost do you count?”Into the lost contribution go the contribution and the time-based direct cost that ran on during the downtime too; the fixed cost and the recoverable material cost do not. The subtle but important point: the cost base of the downtime branch and the scrap branch differs.
- In downtime you add to the contribution the direct cost that runs on time-based: the heating, the circulated medium, the energy kept on standby, the wages that went out even without product.
- In scrap (spoiled but reprocessable product) you count the direct cost that cannot be recovered: if the material can be recycled, its cost is recouped, so it is not a loss; if it burned off time-based, then it is.
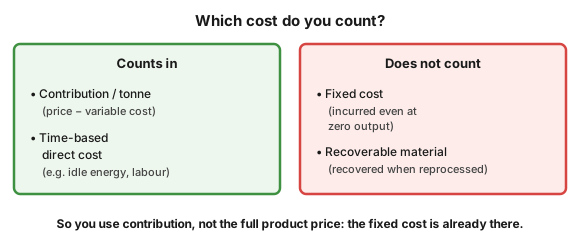
Figure 2 — which cost goes into the lost contribution, and why not the full price.
Margin-constrained or capacity-constrained plant?
Section titled “Margin-constrained or capacity-constrained plant?”The real price of the loss depends on whether the plant can make up the production after restart. Two cases must be sharply separated, otherwise you over- or under-estimate the loss.
Margin-constrained plant. There is spare capacity, the market can absorb the surplus. After the downtime the plant pulls above the average and makes up (catch-up) part or all of the loss. The correctly accounted loss is the net loss: the contribution lost during the downtime minus the part brought back by the catch-up, against the same fixed baseline.
Capacity-constrained, sold-out plant. The plant runs at maximum, every tonne produced has a buyer. Here there is nothing to make up: the loss during the downtime is permanently lost, and if the contract has to be covered from the market, the premium of that cover also burdens the downtime. In this case a lost hour of the bottleneck is a lost hour of the whole plant, because the system’s output is set by the tightest point (the Theory of Constraints).
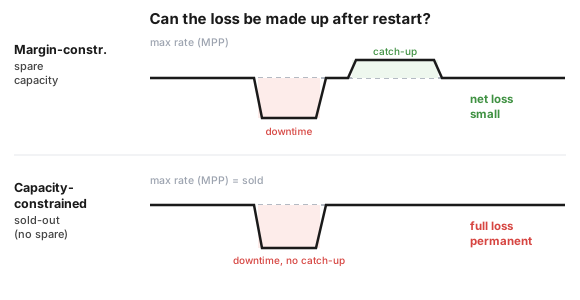
Figure 3 — the post-restart catch-up in the margin-constrained and the capacity-constrained case.
The practical consequence is simple: the same four-hour trip is very different money in two plants. In a capacity-constrained, sold-out situation the payback of a reliability investment is usually much higher, because there every hour won is immediately sellable contribution.
Planned or unplanned downtime?
Section titled “Planned or unplanned downtime?”Not every downtime is the same money. The planned loss (the major shutdown, the turnaround) you price in advance, schedule, and the production plan already accounts for it; the unplanned loss (the trip, the sudden failure) comes on top of that. The ratio of the two gives the on-stream factor: the actual output as a percentage of the nominal capacity.
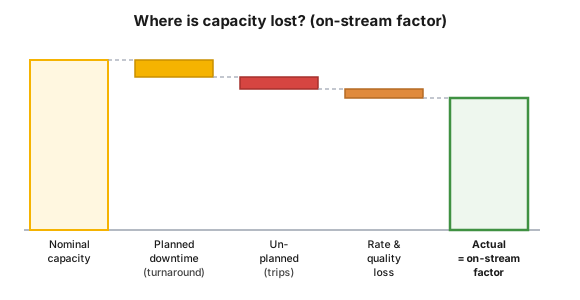
Figure 4 — the on-stream factor waterfall; the breakdown is illustrative.
Unplanned downtime is more expensive for two reasons. First, the repair itself is more costly: according to the literature, unplanned maintenance costs roughly twice as much as well-planned work (parts hunting, improvised solution). Second, it often causes secondary damage too: in a hydrocracker unit a temperature runaway typically means a 2–5 day loss, because restoring the catalyst takes time. That is why it is worth treating unplanned loss separately, with a higher weight.
Process-industry and safety context
Section titled “Process-industry and safety context”In continuous-process technology time produces directly, and availability is direct money. The process industry measures this with the on-stream factor, and often keeps the loss on a separate “lost opportunity” line. The size of the unit margin decides the stake: the profit of a hydrocracker unit can move, depending on the feedstock and market situation, roughly between 30 per barrel, and this margin is what every lost running hour multiplies.
Loss accounting works when you break the downtime down by cause: production plan, ramp-up and ramp-down, operating constraints, mechanical fault, instrument and electrical fault, control and quality reason. This breakdown shows where it is worth putting the reliability resource (see criticality analysis).
Introduction in practice
Section titled “Introduction in practice”A downtime-cost calculation is built up like this:
- Select the specific downtime (a trip or a planned event), and record its length in hours.
- Compute the lost volume: downtime hours × average production rate (t/h).
- Assemble the contribution base: contribution/t plus the time-based direct cost/t (leave out the fixed cost).
- Multiply the volume by the unit value — this is the gross lost contribution.
- Net off the post-restart catch-up (margin-constrained case); in a capacity-constrained, sold-out plant do not net, and add the premium of the market cover.
- Project onto a fixed baseline (Forecast-0), and sum similar events into an annual potential.
Hands-on part — “how much did the last unplanned shutdown cost?”
Section titled “Hands-on part — “how much did the last unplanned shutdown cost?””A half-day workshop is the fastest route to fixing the concept. The participants calculate a specific, recent, unplanned downtime of their own plant through the six steps above, with real rate and contribution. Then a “best of best” exercise assesses the historical losses: comparing the best practice shift by shift, and estimating how much can be extracted if the level of the best shift is locked in with standard operating (SOP). In one documented case, where the spread of the losses was large, this indicated an improvement reaching up to half of the historical losses — an illustrative order of magnitude for how big the stake is. Homework: comparing the price of a planned and an unplanned downtime, with catch-up netting.
Measurement and audit
Section titled “Measurement and audit”A downtime-cost calculation is reliable when it is checked. A minimal checklist:
| Check point | What you look at |
|---|---|
| Cost base | contribution, not the full price; the fixed cost left out |
| Direct cost | the time-based portion counted, the recoverable portion not |
| Catch-up | netted in the margin-constrained case; not in the sold-out case |
| Baseline | fixed plan (Forecast-0), auditable |
| Attribution | the loss tied to an identified cause and owner |
Daily loss accounting (loss accounting at the daily level, per unit, by cause) is what makes the number live for the decision: the cumulative lost contribution shows which cause carries the most money, and where the intervention pays back most.
Common mistakes
Section titled “Common mistakes”- Pricing the loss with the full product price. Why it’s a problem: it overstates, because the fixed cost is incurred during the downtime too. Instead: with the contribution, plus the time-based direct cost.
- Ignoring the catch-up in a margin-constrained plant. Why it’s a problem: whatever you make up after restart, you did not lose. Instead: net off the catch-up, against a fixed baseline.
- Blurring the margin and the capacity constraint. Why it’s a problem: in a sold-out plant there is no catch-up, the loss is permanent, and the market premium burdens it too. Instead: first decide which constraint applies.
- Taking the unplanned loss to be equal to the planned one. Why it’s a problem: the planned loss is priced in, the trip is not. Instead: treat it separately, with a higher weight.
- Wrong attribution to an event. Why it’s a problem: if the loss cannot be tied to a cause and an owner, it cannot be prioritized. Instead: for every downtime a cause, a timestamp, an owner.
When NOT to use it?
Section titled “When NOT to use it?”The lost contribution is a strong decision-support number, but it is not the right answer to every situation:
| Situation | Why not primarily this | The right answer |
|---|---|---|
| No free demand (not sold-out, but the surplus is not sellable either) | the “won” volume has no buyer, the contribution is not realized | first a market / demand-side check, only then the contribution number |
| Certified safety or regulatory shutdown | the shutdown is forced by a protection function or a rule, not an economic bargain | criticality analysis, the priority of the safety layer |
| Transient state (start-up, shutdown, ramp-up) | the rate and the contribution have not settled, the momentary number misleads | separate handling per the shutdown and start-up procedures |
| A blurred loss not tied to a single action | wrong attribution → wrong prioritization | first loss accounting and cause breakdown, only then pricing |
Rule of thumb: the lost contribution is the strongest, cheap tool for ranking downtime events and justifying the reliability investment. It does not replace the safety decision, and it does not substitute for demand.
Take it home (keys)
Section titled “Take it home (keys)”- Price it, or it is invisible. As long as the downtime is only a log line, reliability loses out to the visible cost.
- Contribution, not the full price. The fixed cost is incurred during the downtime too, so it does not belong in the loss.
- Hours × rate × (contribution + time-based cost). Know this formula by heart; the rest is its refinement.
- The constraint first. Decide whether the plant is margin- or capacity-constrained, and net off the catch-up where there is one.
- The unplanned is more expensive. Treat the trip separately, and tie it to a cause, an owner, a timestamp.
- The number is made for action. You use it to rank downtime events and to justify the investment; the detailed benefit accounting is the job of benefit calculation.
Self-test
Section titled “Self-test”- A 48-hour downtime, 20 t/h average rate, 150 €/t contribution, 40 €/t time-based direct cost. What is the lost contribution?
- Why do you not calculate with the full product price, but with the contribution? What would happen to the fixed cost if you counted it in?
- The same four-hour trip in a margin-constrained and in a capacity-constrained (sold-out) plant. In which is the net loss larger, and why?
Answer key: 1) 48 × 20 = 960 t; 960 × (150 + 40) = 182,400 €. · 2) Because the fixed cost is incurred during the downtime too, so the loss does not increase it; if you used the full price, you would overstate by the fixed cost that is already incurred. · 3) In the capacity-constrained one, because there is no post-restart catch-up there, the loss is permanent, and the premium of the market cover can burden it too; in the margin-constrained one the catch-up nets off the loss.
How does it appear in digital practice?
Section titled “How does it appear in digital practice?”Turning downtime into money does not stop at the monthly manual calculation: the same logic is realized in software, close to real time, in a production and reliability system.
| Concept | Digital implementation | What it delivers |
|---|---|---|
| Lost hours | automatic downtime capture from the process data, with a timestamp | the loss is not a manual estimate but measured data |
| Lost volume | rate × time automatic calculation, against a fixed baseline (Forecast-0) | the tonne is produced immediately, consistently |
| Contribution-based valuation | the lost volume valued at margin, close to real time | the downtime shows up in money at once, not months later |
| Cause attribution | the downtime tied to a cause, a unit, an owner | the cumulative loss prioritizes the intervention |
| On-stream factor | automatic availability and loss breakdown | planned and unplanned loss are separated and can be trended |
Connection to OPEREX (shift log)
Section titled “Connection to OPEREX (shift log)”Calculating the lost contribution stands or falls on whether the base data of the downtime is recorded accurately and on time. A digital shift log (OPEREX) records the cause, the start and end timestamps and the owner of the downtime in a structured way, as the event happens. From here the lost contribution can be traced back afterwards to the specific event, and the daily and monthly total can be summed auditably: the downtime does not stay a forgotten log line, but becomes data measured shift by shift and turned into money.
What do you see of this in the management report?
Section titled “What do you see of this in the management report?”The downtime shows up on several report lines, and reading them together shows where the money is lost: the availability line shows the how much, the lost-contribution line the how much it cost.
| Report line | What drives it | What you can do with it |
|---|---|---|
| availability | planned and unplanned downtime; the mechanical (MA) and the operational (OA) availability break out the machine and the operating cause separately | you decide whether the loss is on the maintenance or the operating side |
| on-stream factor | the ratio of the actual output remaining from the nominal capacity after deducting the downtime and the rate loss | you trend the actual utilization, and compare it with the benchmark |
| lost contribution | the lost hours × rate × contribution, summed by cause | you rank the downtime causes, and justify the reliability investment |
The rule: the availability line signals the problem, the lost-contribution line prioritizes it. The relationship of the three availability metrics (mechanical, operational, on-stream) is derived by the OEE and the reliability KPIs article; here the focus is only on turning it into money.
Terminology (HU / EN / JP)
Section titled “Terminology (HU / EN / JP)”| Hungarian | English (canonical) | Japanese / note |
|---|---|---|
| Állásidő / leállási óra | Downtime | 停止時間 (teishi jikan) |
| Kiesett termelés | Lost production | — |
| Kiesett / elmaradt fedezet | Lost contribution / lost profit opportunity | — |
| Fedezet | Contribution (margin) | — |
| Rendelkezésre állás | Availability | 稼働率 (kadōritsu) |
| Üzemidő-arány | On-stream factor | — |
| Beindulás utáni pótlás | Catch-up | — |
| Nagyleállás | Turnaround | — |
| Maximális termelési potenciál | Maximum production potential (MPP) | — |
How much does one downtime hour cost?
As much as the contribution that was forgone in that hour: the average production rate (t/h) multiplied by the contribution per tonne, plus the time-based direct cost. You do not count the fixed cost, because it is incurred during the downtime too.
Why do you calculate with the contribution, and not with the full price of the product?
Because the full price contains the fixed cost too, which is incurred regardless of the downtime. The downtime takes away only what would have been left to cover the fixed cost and the profit — that is, the contribution.
What is the difference between a margin-constrained and a capacity-constrained plant in the price of the loss?
In a margin-constrained plant there is spare capacity, the production can be made up after restart, so the net loss can be small. In a capacity-constrained, sold-out plant there is no catch-up, the full loss is permanent, and the premium of the market cover can burden it too.
Why is unplanned downtime more expensive than planned?
The planned downtime (turnaround) is priced into the production plan and the on-stream factor, the unplanned trip comes on top of that. On top of this, the unplanned event often causes secondary damage too, so it must be treated with a higher weight.
Related concepts
Section titled “Related concepts”cost structure and contribution | benefit calculation | OEE | profit per hour | reliability KPIs | criticality analysis | production reliability program | shutdown and start-up procedures | shift handover | muda | SMED
Next step
Section titled “Next step”From here it is worth going on, in this order:
- cost structure and contribution — the full derivation of contribution, fixed and variable cost, so that there is solid ground under the conversion factor.
- OEE — how availability breaks down into measurable losses that you can turn into money.
- benefit calculation — accounting the availability won as an improvement benefit.
References / further reading
Section titled “References / further reading”- Eliyahu M. Goldratt – Jeff Cox: The Goal. North River Press, 1984 — a lost hour of the bottleneck is a lost hour of the whole system (Theory of Constraints).
- Charles T. Horngren, Srikant M. Datar, Madhav V. Rajan: Cost Accounting: A Managerial Emphasis. Pearson — the concept of contribution margin and the cost relevant to the decision.
- Eduardo Calixto: Gas and Oil Reliability Engineering. Elsevier, 2016 — the economic value of availability and reliability.
- Ron Moore: Making Common Sense Common Practice: Models for Manufacturing Excellence. Butterworth-Heinemann — the cost of reactive maintenance and lost production.
- Solomon Associates — process-industry benchmarking, where the on-stream factor and capacity utilization are a central performance measure.