Working capital and the cash-gap
≈ 19 min read · 3,708 words
You paid for the raw material in March, delivered the product in April, the invoice is due in 30 days — but payroll goes out on the 5th of every month. On paper it was an excellent month, yet for weeks the money you have already earned is not in the bank account. This gap is the working capital, measured in time the cash conversion cycle, in the jargon the cash-gap.
Working capital is the cash tied up in daily operations: inventory plus receivables minus payables. In days it is the cash-gap: DIS + DSO − DPO.
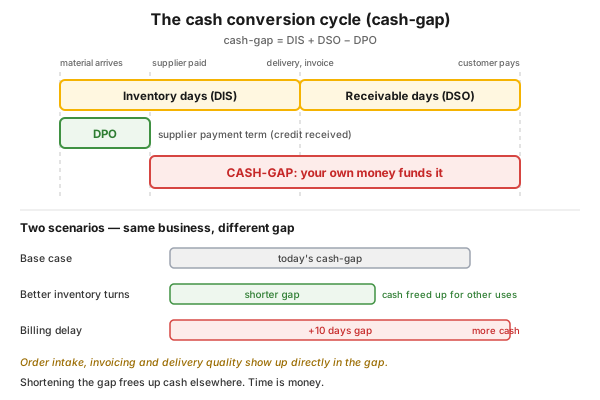
Figure 1 — the cash conversion cycle timeline: improving inventory turns shortens the gap, slipping invoicing lengthens it.
Who is this for?
Section titled “Who is this for?”For those who make capital-tying decisions without being finance people: plant manager · shift supervisor · process engineer · production planner · maintenance manager · storekeeper · buyer · project manager · Lean/CI coordinator.
Learning objectives
Section titled “Learning objectives”After reading this article you will be able to:
- calculate the three day-metrics of your own area (DSO, DIS, DPO), stating the convention;
- say how much a day of slippage costs you;
- recognize the hidden credit, from the invoicing lead time to the safety stock;
- decide when the cash-gap must not be squeezed any further.
In brief
Section titled “In brief”- Working capital is the cash stuck in operations: inventory + receivables − payables; measured in days this is the cash-gap.
- Tied-up capital has a cost of capital, which is real but invisible on the income statement.
- Most of the gap is an operational matter: cycle length, stock level, invoicing lead time, overdue items.
- The engineer and the accountant define it differently, and both are right.
- A payment term is an interest-free loan, so it must be priced.
Why it matters — profitable, yet running out of cash
Section titled “Why it matters — profitable, yet running out of cash”Because profit and cash do not arise at the same moment, and solvency runs out first. The classic risk: the company earns a profit but does not generate cash. If collection slows, it does not show up in the profit but as a rise in tied-up capital, where nobody is looking for it.
What is working capital? The engineer’s and the accountant’s definition
Section titled “What is working capital? The engineer’s and the accountant’s definition”The same item, answering two questions: the engineer asks how much material the plant needs to run, the accountant how much money it ties up.
| The engineer’s view | The accountant’s view | |
|---|---|---|
| What belongs in it | all stored material and the recoverable assets | inventory + receivables − payables + cash |
| When it arises | invested at start-up, recovered at project end | as a stock, on every reporting date |
| What it is used for | plant planning, investment decision | financial analysis, liquidity, payback |
The cash term is included by some conventions and not by others, and the same holds for tax: it depends on the nature of the analysis, which is why you must write the formula next to the number. The accounting boundary is drawn by the classification rule: an item is current if it is realized within the operating cycle or twelve months, or is freely usable cash. That is why the engineering number and the financial number are not the same: not an error, but a different question.
Where does working capital sit on the balance sheet?
Section titled “Where does working capital sit on the balance sheet?”In the economic view, where it already has a price: the same balance-sheet figures can be rearranged around the question how much capital is needed to operate, and out of what we cover it.
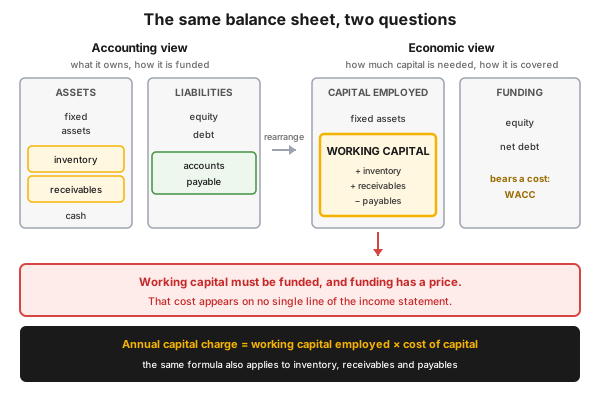
Figure 2 — the same balance sheet in two views: working capital moves over to the side of the capital to be funded.
Inventory and receivables are tied-up capital, payables are a deduction, since the supplier finances them. What remains is the working capital, which — together with the fixed assets — is covered by equity and net debt; this step is what makes it a costly item. The balance-sheet structure is derived in the three financial statements.
How do you calculate DSO, DIS and DPO?
Section titled “How do you calculate DSO, DIS and DPO?”All three do the same thing: they divide a balance-sheet stock by turnover and turn it into days; the “days” are the calendar days of the period.
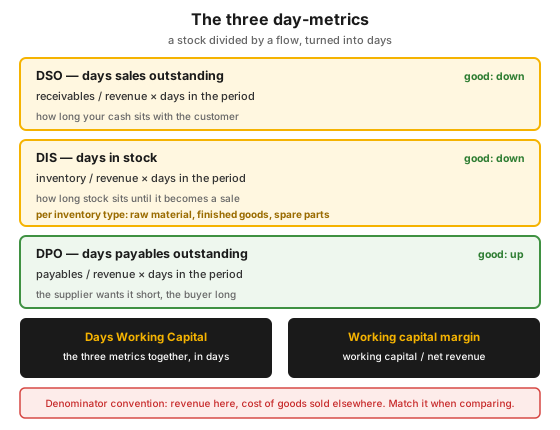
Figure 3 — the three day-metrics and the two aggregates.
| Metric | What it measures | Formula | Good direction |
|---|---|---|---|
| DSO (days sales outstanding) | how long the money sits with the customer | receivables / revenue × days | shorter |
| DIS (days in stock) | how long stock sits until it is sold | inventory / revenue × days | shorter |
| DPO (days payables outstanding) | how long you take to pay | payables / revenue × days | longer |
| Days Working Capital | the three together | DSO + DIS + DPO | shorter |
| Working capital margin | capital per unit of revenue | working capital / net revenue | smaller |
DIS must be calculated separately per inventory type (raw material, finished goods, spare parts): the pooled inventory-day figure does not tell you where the money is standing. And DSO is hidden by the overdue items, so you must put the share of the overdue balance next to it.
What is the cash conversion cycle (cash-gap)?
Section titled “What is the cash conversion cycle (cash-gap)?”Working capital expressed in time: inventory days + receivable days − supplier days. For this long the company finances its operation from its own resources, and cannot use the tied-up capital for anything else. Squeezing the gap is therefore real money: it frees up cash for development without raising new funds.
Two scenarios show how much this is an operational question. The positive case is improving inventory turns: fewer days in stock, a shorter gap, freed-up cash. The negative is invoicing slippage: the delay between dispatch and issuing the invoice can lengthen the gap by as much as ten days, even though the business is the same. In Lean terms this is the oldest question, shortening the timeline from the order to the money coming in; flow, vsm and the pull system attack exactly this gap.
Why does tied-up capital cost money?
Section titled “Why does tied-up capital cost money?”Because working capital must be funded, and funding has a price that does not appear on the income statement. The weighted average cost of capital (WACC) is the minimum return the company must earn on its asset base to serve its lenders and its owners.
WACC = (share of equity × cost of equity) + (share of debt × cost of debt × (1 − tax rate))
From here comes the capital charge: the tied-up capital multiplied by the cost of capital gives the annual cost, applied separately to receivables, to inventory and to payables. The price of a single day is 1 day × cost of capital / days in the year: at a 15% cost of capital and a 360-day year, that is 0.042% per day — i.e. a late-paying customer should be charged at least this much.
Hidden and agreed credit: where does a day leak away?
Section titled “Hidden and agreed credit: where does a day leak away?”Two kinds of credit sit in the cycle. The agreed credit is the contracted payment term: visible and plannable. The hidden credit is every further, unpriced day of loss that comes from the behaviour of the customer, the supplier or your own routines. The eight typical items:
| Customer side: the money comes in later | Supplier side: the money goes out earlier |
|---|---|
| the customer pays later than contracted | paying too early |
| a dispute with the customer over the invoice | pre-invoicing |
| delay between dispatch and invoicing | post-dating the invoice |
| wrong payment terms on the invoice | paying a disputed invoice |
| too high a safety stock |
The most expensive outcome is the bad debt: a receivable that remains uncollectible even after collection attempts and must be written off. This is no longer a cost of capital but an expense that reduces the year’s profit, which companies estimate in advance from past experience. And DPO is a consequence of procurement discipline: the payment term of a purchase order is a controlled attribute, and changing it requires re-approval.
How much does a payment term cost?
Section titled “How much does a payment term cost?”A payment term granted to the customer is an interest-free loan: its cost is the product of the outstanding amount, the number of days and the cost of capital. The alternative is the cash discount (skonto), a price reduction for early payment; the cost of the two can be equalized, i.e. for a given discount you can work out how many days you can offer at the same cost. A longer term pays beyond the capital charge too: the receivables loss and the bad debt both grow.
What do you see of this in the management report?
Section titled “What do you see of this in the management report?”On three lines: inventory, receivables, payables; all three are moved by operational decisions, through eight drivers.
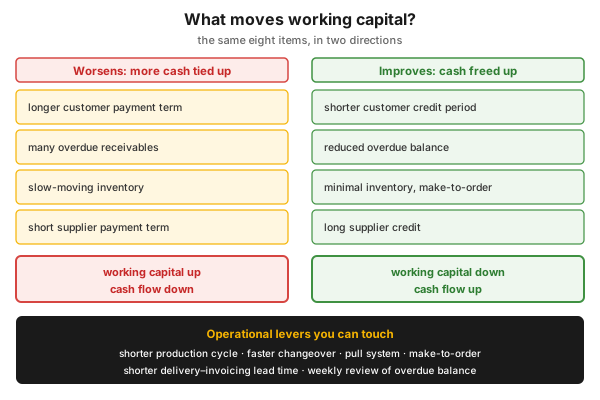
Figure 4 — the eight drivers of working capital, with the operational levers below.
In the operating cash flow these three lines also take a sign: if inventory or receivables rise, cash flow falls by that much; if payables rise, it increases by that much (and the reverse for a decrease).
The connection leads all the way to the return on capital: the return on invested capital (ROIC) depends on the margin and the tied-up capital, so inventory reduction also improves the return through asset turnover. Planning orders of magnitude (not a guarantee): inventory can be cut by 10–30%, and a lead time five days shorter together with 95–98% delivery accuracy also brings down the required stock level.
Inventory reduction is double-acting: a recurring saving on the cost of capital, plus a one-off cash effect if you also get rid of the surplus (run-out, a trade promotion, low-value scrapping). Beyond the cost of capital, the price of holding stock is administration, insurance, storage space and obsolescence — as a rule of thumb roughly 25% of the product value per year.
A worked example. A plant switched to a shorter production cycle, so it held the same service level with a target stock lower by 6,874 tonnes (EUR 310/tonne product value, 7.05% cost of capital):
- recurring effect: 6,874 × 310 × 7.05% / 1000 = EUR 150,000 in annual cost-of-capital savings;
- one-off effect: getting rid of the surplus, with a EUR 190/tonne contribution, a EUR 1,206,000 one-off result (the target-stock reduction comes from the official calculation model).
The proposal is complete only when you compute both lines, and say where the freed-up cash goes.
Process-industry and safety context
Section titled “Process-industry and safety context”In the process industry working capital is not an abstract balance-sheet item but a tank, a silo, a catalyst charge and a warehouse shelf. Two things work differently: the estimate builds on rules of thumb, and the physical stock is not the inventory line of the balance sheet.
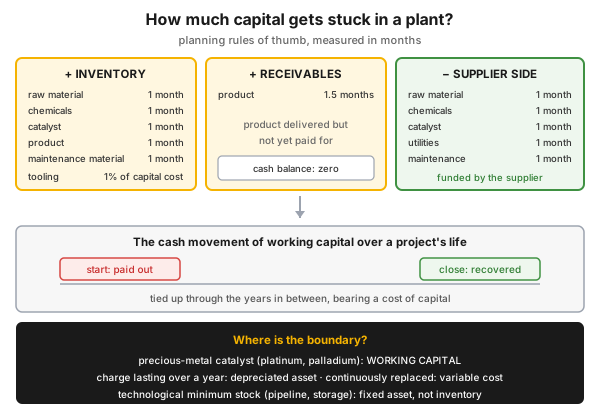
Figure 5 — operational working-capital estimate and the classification boundary lines.
Estimating at plant planning. In the economic calculation of a new plant, working capital can be estimated item by item: the inventory side (raw material, chemicals, catalyst, product, maintenance material) and the supplier side one month each, receivables one and a half months, tooling one percent of the investment, and cash zero.
Where is the classification boundary? Three cases:
- the precious-metal catalyst (platinum, palladium) is working capital, because it is recoverable value;
- a charge with a life longer than one year is a depreciated asset, while the continuously replaced catalyst is a variable cost;
- the minimum product level of a pipeline and a gas storage (line fill, cushion gas) is a fixed asset, whereas one’s own product stored at a third party is inventory.
The spare-parts stock. In most organizations the maintenance (MRO) parts make up 40–60% of the total maintenance cost, and the annual cost of holding them is as much as 30% of the purchase price. Hence the conflict: maintenance wants availability, procurement wants less tied-up capital; the resolution is inventory management sized to a service level (see wrench time).
A special peak is the stock deliberately built up before a planned turnaround (in Lean terms “banking”), so that the next process can keep producing during the shutdown. This is a plan, not an error, which is why the day-metrics must be read as a trend.
Putting it into practice (roadmap)
Section titled “Putting it into practice (roadmap)”In five steps you can connect your area to working capital.
- Calculate the three day-metrics, and write the denominator and the year length next to the number.
- Break the number down by group, to reveal where the money is standing.
- Find the hidden credit: the dispatch-to-invoicing lead time and the overdue receivables.
- Turn the payment term into a price: every term change and every discount offer.
- Tie it to an operational action: cycle shortening, faster changeover (smed), a pull system (kanban) or make-to-order, with both cash effects.
Hands-on: what is your cash-gap?
Section titled “Hands-on: what is your cash-gap?”Workshop, two hours, in a group. Take the average balances of the last two reporting dates and the revenue of the period, calculate the three day-metrics, then the working capital margin and the annual capital charge.
Applied task, alone, one hour. Estimate the working capital of your own plant using the planning guidelines, then add a proposal that takes five days off the gap, with both cash effects.
Measurement / audit
Section titled “Measurement / audit”Six metrics are enough to see it before the close, not only after:
| Metric | Frequency | Data source | Typical owner |
|---|---|---|---|
| DSO and the share of the overdue balance | monthly | receivables ledger | sales, finance |
| DIS per inventory type | monthly | inventory records | production planning, warehouse |
| DPO | monthly | payables records | procurement |
| Days Working Capital and working capital margin | monthly, and quarterly | the above, balance sheet | operational and financial management |
| Dispatch-to-invoicing lead time | weekly | dispatch data | plant |
A complementary metric is the inventory turns (inventory × 365 / cost of goods sold). The metrics go onto the performance board (KPI definition).
Common mistakes
Section titled “Common mistakes”- A day-metric calculated from a reporting-date balance. Why it’s a problem: a single day does not characterize the period. Instead: average balance-sheet items, add up income-statement lines.
- DIS pooled, without a type breakdown. Why it’s a problem: you cannot see where the money is standing. Instead: separately for raw material, finished goods, spare parts.
- Leaving the hidden credit unpriced. Why it’s a problem: it costs the same as the contracted term, only you did not plan it. Instead: measure the lead time and the overdue balance.
- Driving inventory to zero. Why it’s a problem: at the expense of availability it is not a saving but a risk. Instead: a level sized to the service level.
- Leaving the working-capital effect out of the benefit calculation. Why it’s a problem: it looks good on contribution while it ties up capital. Instead: one line for the capital, one for the cash effect.
- Stretching DPO by burning the supplier relationship. Why it’s a problem: you loaded your gap onto the supplier, who takes it back in the price. Instead: a negotiated term, your own discipline.
When NOT to use it — the limits of the metrics
Section titled “When NOT to use it — the limits of the metrics”The day-metrics are powerful but do not answer every question, and comparing them on their own is misleading.
| Situation | Why not primarily this | The right answer | |
|---|---|---|---|
| Setting a target from an industry benchmark | inventory days differ by industry and convention | your own time series with the same convention | |
| A seasonal or turnaround-cycle plant | the planned stock peak is the nature of the cycle | a moving average, aligned to the shutdown cycle | |
| A daily, shift-level decision is needed | the metrics give a monthly, aggregated picture | [[performance-board.en | performance board]] |
| Ranking an investment decision | the day-metric does not measure the time value of money | discounted cash flow |
Rule of thumb: the metrics tell you where your money is standing, but not whether it may be taken from there. This article is a decision-preparation framework, not financial or investment advice.
Take it home (keys)
Section titled “Take it home (keys)”- Calculate your three day-metrics with the convention spelled out.
- Ask how much a day is for you: day × cost of capital / days in the year. This makes every slippage negotiable.
- Measure the dispatch-to-invoicing lead time: the most easily improved day of loss.
- Turn every payment-term change into a price, compared with the discount.
- On inventory reduction, put both numbers down: the annual cost of capital and the one-off cash.
Self-test
Section titled “Self-test”- You sold 100 units of value, on 30-day terms. What happens today and 30 days later in the profit, the balance sheet, the working capital and the cash flow?
- Why is it wrong to calculate DIS from a reporting-date inventory balance?
- The customer pays ten days later than contracted. In which metric does it show, and what is its cost?
Answer key: 1) Today: revenue +100, receivables +100, working capital +100, cash flow 0. 30 days later: profit 0, receivables −100, cash +100, working capital −100, cash flow +100. · 2) Because the balance sheet is valid for a single point in time, and an exceptional item distorts it; correctly, with an average balance, per type. · 3) In DSO; the outstanding amount × 10 days × cost of capital / days in the year.
How does it show up in digital practice?
Section titled “How does it show up in digital practice?”Working capital does not begin in the accounts but at the operational event. If the event is recorded with a timestamp, at the place it arises, the day-metrics come from data, not from memory.
| Working-capital element | Digital implementation | What it delivers |
|---|---|---|
| Inventory days (DIS) | inventory movement with a timestamp, by type | inventory days per type, in trend |
| Receivable days (DSO) | the dispatch and the invoicing time together | a measurable invoicing lead time |
| Hidden credit | tracking overdue items and disputes with an owner | a named, closable day of loss |
| Auditability | a document and timestamp for every movement | a traceable cash effect |
Connection to OPEREX (shift log)
Section titled “Connection to OPEREX (shift log)”The working-capital effect can be defended only if there is an operational data series behind it. A digital shift log (OPEREX) records the inventory movement, the off-spec quantity and the downtime shift by shift, with an owner and a timestamp; from this the trend of the day-metrics and the cash effect of an improvement can be derived independently of the monthly close.
Terminology (HU / EN)
Section titled “Terminology (HU / EN)”| Hungarian | English (canonical) | Note |
|---|---|---|
| Működőtőke (forgótőke) | working capital / net working capital (NWC) | the cash stuck in operations |
| Pénzkonverziós ciklus, cash-gap | cash conversion cycle / cash-gap | working capital in days |
| Beszedési idő | days sales outstanding (DSO) | customer side |
| Készletnap | days in stock (DIS) / days inventory (DIO) | per type |
| Szállítói fizetési idő | days payables outstanding (DPO) | supplier side |
| Működőtőke-hányad | working capital margin | / net revenue |
| Fizetési feltétel | payment conditions | interest-free loan |
| Rejtett hitel | hidden credit | an unpriced day |
| Skonto | cash discount | discount for early payment |
| Kétes követelés | bad debt | uncollectible |
| Tőketerhelés | capital charge | capital × cost of capital |
What is working capital, simply?
The cash stuck in daily operations: inventory and receivables minus payables. It must be funded, even when the company is profitable.
What is the difference between working capital and the cash conversion cycle?
The same thing in two units. Working capital is a stock measured in money, the cash conversion cycle (cash-gap) is the same in days: inventory days + receivable days − supplier days. The day form is independent of turnover, so it is comparable.
How do I calculate DSO, DIS and DPO?
You divide the average balance-sheet stock by turnover and multiply by the days of the period: DSO = receivables / revenue × days, DIS = inventory / revenue × days, DPO = payables / revenue × days.
Why is the cost of working capital not visible on the income statement?
Because tied-up capital is not a booked expense but a funding need. The cost becomes visible when you multiply it by the cost of capital; that is the capital charge.
Is it good to pay the supplier as late as possible?
Only as long as it is a negotiated term. Stretching DPO shortens the cash-gap, but if it comes from a one-sided delay, the supplier takes it back in the price.
What can a plant manager do to squeeze the cash-gap?
Shorten the production cycle and the changeover time, reduce surplus inventory without touching the critical reserve, and measure the dispatch-to-invoicing lead time.
Related concepts
Section titled “Related concepts”the three financial statements | financial vs. management reporting | flow | vsm | pull system | kanban | smed | muda | oee | profit per hour | KPI definition | performance board
Next step
Section titled “Next step”From here it is worth going on, in this order:
- the three financial statements — where the numbers of the day-metrics come from.
- flow — why a long lead time is tied-up capital.
- profit per hour — how daily operation turns into a decision in the language of money.
References / further reading
Section titled “References / further reading”- IAS 1 — Presentation of Financial Statements (IASB) — the classification of current items.
- IAS 7 — Statement of Cash Flows (IASB) — the change in working capital within cash flow.
- Taiichi Ohno: Toyota Production System. Productivity Press, 1988.
- Abol Ardalan: Economic & Financial Analysis for Engineering & Project Management. Technomic, 2000.