Cost structure and break-even point
≈ 17 min read · 3,454 words
You go away for a week. The rent, the insurance and the subscriptions still leave your account, but you spend nothing on fuel or lunch. That is the difference between the two kinds of cost, and it works the same way in a plant: one is payable even if not a single ton is made, the other arises only during production. Let’s look at what a fixed and a variable cost mean, and how they become contribution and the break-even point.
Contribution is net revenue minus variable costs: the amount left to cover fixed costs. The break-even point is fixed cost divided by the unit contribution.
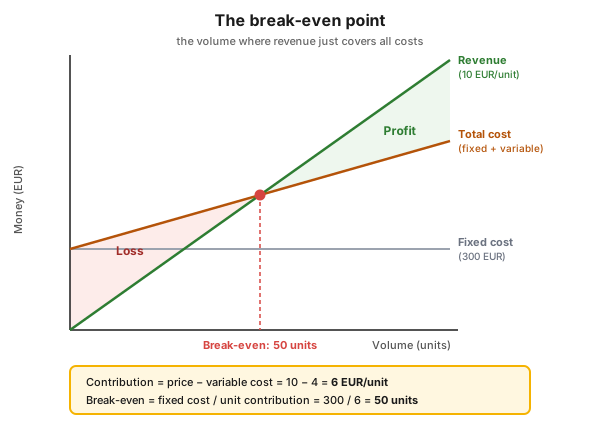
Figure 1 — the break-even point: below the intersection there is loss, above it profit. The 300 EUR fixed cost is illustrative.
Who is this for?
Section titled “Who is this for?”For those who argue with numbers even without being finance people: plant manager · shift supervisor · process engineer · maintenance manager · energy engineer · Lean/CI coordinator · project engineer · controlling partner.
Learning objectives
Section titled “Learning objectives”After reading this article you will be able to:
- classify a cost item along three independent cuts (fixed or variable, direct or indirect, controllable or not);
- calculate a product’s contribution, contribution margin and break-even point;
- turn an improvement idea into money using the right cost base, and say when the contribution view cannot be used.
In brief
Section titled “In brief”- Fixed cost: payable even at zero output (rent, administrative wages, insurance, depreciation).
- Variable cost: moves in proportion to volume (raw material, energy, transport, chemicals, packaging).
- Contribution = net revenue − variable costs. The simplest measure of an individual product’s profitability.
- The condition of profit is that contribution exceeds the fixed cost. Contribution on its own is not profit.
- The fixed cost per unit falls with volume, which is why every ton gets more expensive when you cut the load. In the long run, every cost is variable.
- A decision needs the marginal, not the average cost. This is the recurring error of contribution calculation.
Why does every ton get more expensive when you cut the load?
Section titled “Why does every ton get more expensive when you cut the load?”Because the fixed cost cannot slow down with you: the amount is the same, only spread over fewer units. The reverse is also true, but not without limit: the unit fall ends at capacity, which is why economies of scale have an optimum (the ideal plant size).
In one improvement program an 18 percent increase in throughput cut the fixed cost per unit by 18 percent: the same output needed one fewer operating day per week. The other stake is the calculation error: the benefit of an energy-efficiency package was computed on a weighted annual average price, together with the fixed cost that could not be saved; in a scenario without a power plant this method would have overstated the steam saving by about 20 percent.
What is a fixed and what is a variable cost?
Section titled “What is a fixed and what is a variable cost?”The two categories differ in their response to volume.
| Fixed cost | Variable cost | |
|---|---|---|
| Typical items | rent, administrative wages, insurance, depreciation | raw material, energy, transport |
| Process-industry items | staff and supervision, maintenance, fixed utilities, lab, plant overhead, property tax | catalyst and chemicals, utilities, packaging, running royalty |
| Behavior | the amount per unit falls with volume | the amount per unit is constant |
Without two provisos the definition is misleading.
The first: a fixed cost is fixed only over a given time horizon. Over a long period every cost becomes variable: contracts expire, headcount can be reshaped, an asset can be sold. This is why process-industry investment appraisal counts the operator wage among fixed costs, while an engineering-economics textbook treats labor as variable: the classification follows from the time horizon and the contractual arrangement.
The second: fixed is not the same as unavoidable. At one plant a lab capacity was kept around the clock for a contamination test, even though the product was shipped in dedicated, clean tank cars. It took five people, each at a cash cost of over USD 100,000 a year, to look for a fault that never occurred. The test had been introduced fifty years earlier, in the days of shared tank cars, and was never reviewed.
How many cuts does a cost have?
Section titled “How many cuts does a cost have?”Three, and each is independent of the other two. Whoever knows only the fixed-variable cut confuses direct cost with variable.
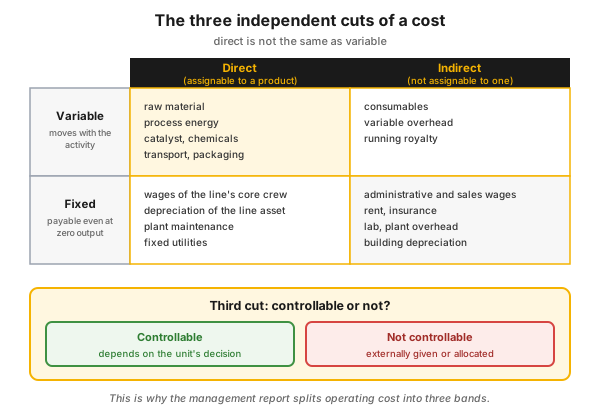
Figure 2 — the three cuts: fixed or variable, direct or indirect, controllable or not.
- Fixed or variable — by the response to volume.
- Direct or indirect — a direct cost can be assigned to a specific product (raw material), an indirect one cannot (the building’s rent).
- Controllable or not — the management report splits operating cost into variable, volume-independent, and non-controllable parts, by cost type.
The practical benefit comes from the third: argue about the half of the report you can influence. A cost-reduction program breaks the fixed cost into blocks, and organizes an idea-generation workshop only for the significant sub-categories.
How do you calculate contribution and the break-even point?
Section titled “How do you calculate contribution and the break-even point?”Two formulas: contribution = net revenue − variable costs, and break-even point = fixed cost / unit contribution.
The contribution staircase
Section titled “The contribution staircase”Contribution is one step of a staircase. If you deduct only the raw material from the net revenue, you get added value; after deducting all variable costs, contribution; after deducting the fixed cost, EBITDA.
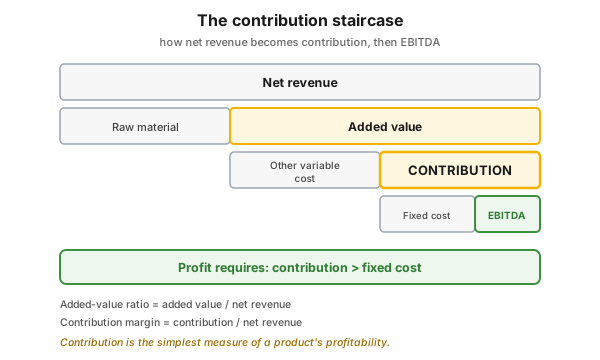
Figure 3 — the contribution staircase and the condition of profit.
Each step also has a ratio, because the absolute number is not comparable across two products of different size: the added-value ratio and the contribution margin project onto net revenue.
Deriving the break-even point
Section titled “Deriving the break-even point”Take a product with 10 EUR revenue per unit and 4 EUR variable cost: its contribution is 6 EUR/unit, its contribution margin 60%. If the fixed cost is 300 EUR (an illustrative value), the break-even point is 300 / 6 = 50 units. Figure 1 draws the same thing: the steeper revenue line cuts the total cost at the 50th unit.
Which price should you use?
Section titled “Which price should you use?”The price-side counterpart is the minimum selling price: what is the lowest price that, at a given discount rate (typically 9%), pays back every production and capital cost? This is the netback price — not a market price but a decision threshold. A threshold, but not a ranking: it ignores inflation, and says nothing about the project’s attractiveness. The source of the price matters too:
| Price type | What it means | For economic appraisal |
|---|---|---|
| netback price | the minimum selling price that pays back every production and capital cost | yes, as a threshold |
| rational price | a hypothetical price, with the cost of every step in the value chain | yes, for the long run |
| half-year operating-plan price | a short-term estimate that changes month to month | yes, for monthly optimization |
| transfer price | a negotiated price between units within the company | no |
| annual plan price | a price used for budgeting, differing by site | no |
In oil refining the threshold appears as a chain: from the gross product worth, deducting the variable processing cost gives the plant-gate value; deducting freight gives the netback value; deducting the feedstock price too gives the netback margin. The question is the same: should we run the plant, or buy the product from the market?
Why isn’t the next ton worth the same?
Section titled “Why isn’t the next ton worth the same?”Because once the fixed cost has been paid by the volume already made, almost all of the next unit’s contribution becomes profit. The surplus after debottlenecking is the most profitable production a plant makes:
| Item ($/unit) | With the bottleneck | After debottlenecking, on the incremental volume | Change |
|---|---|---|---|
| Selling price | 200 | 200 | — |
| Feedstock cost | 100 | 100 | — |
| Variable cost | 20 | 20 | — |
| Fixed cost | 60 | 0 | −60 |
| Profit | 20 | 80 | fourfold |
The fixed cost has not disappeared, it is only already covered: the building, the overhead and the management headcount do not grow because the line runs faster, so the incremental fixed cost is very low. This is why a changeover reduction or an OEE improvement pays back so quickly.
What makes up the cost of a process-industry plant?
Section titled “What makes up the cost of a process-industry plant?”A single connected identity: net cash flow = gross revenue − variable costs − fixed costs − capital charges − taxes.
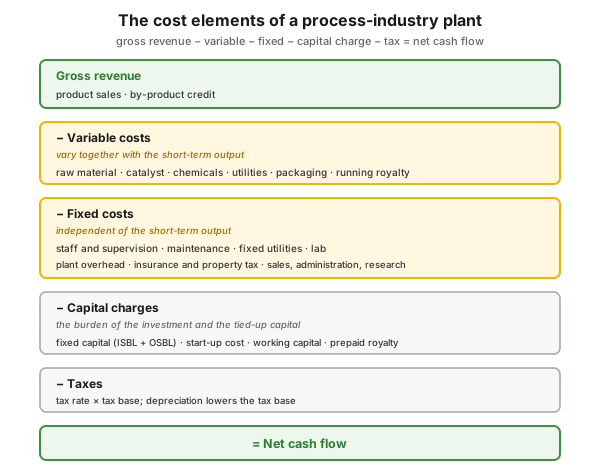
Figure 4 — the elements of production cost, from gross revenue to net cash flow.
The variable costs move with output: raw material, catalyst and chemicals, utilities, packaging, running royalty. The fixed costs are independent of it: staff, maintenance, fixed utilities, lab, plant overhead, insurance and property tax, sales, administration, research. In an early phase they are estimated with rules of thumb; the numbers are orders of magnitude based on plant cost statements from the early 1990s:
| Fixed cost item | Estimating rule of thumb |
|---|---|
| Annual staffing cost | 17,700 × operator hourly wage × operators/shift |
| Maintenance (outside battery limits, OSBL) | ~2% of the OSBL capital per year, two-thirds wages, one-third material |
| Fixed utilities | ~25% of the variable utility cost (excluding certain items) |
| Lab | ~30% of the operator and supervisory wage |
| Plant overhead | ~40% of the preceding four fixed items |
| Property tax / insurance | 0.6% / 0.1% of the total fixed capital per year |
The accuracy of the matching capital cost estimate is classified: order-of-magnitude is ±40%, the most detailed ±10%. Do not build a payback accurate to the decimal on a ±40% estimate.
What do you see of this in the management report?
Section titled “What do you see of this in the management report?”| Report line | What drives it | What you can do with it |
|---|---|---|
| contribution (HUF/t or %) | product mix, load, specific consumption | which product is worth running on scarce capacity |
| variable cost | raw material, energy, chemicals | the spread of the specifics: where the money goes |
| fixed cost | headcount, maintenance, overhead | in a load reduction it does not follow the volume |
The rule: for a load decision look at the contribution, not the specific unit cost, because the latter is distorted by the allocation of the fixed cost. The plant reading of the bands is in the management report article.
Process-industry and safety context
Section titled “Process-industry and safety context”The cost structure of the process industry differs from the manufacturing average at three points, and all three fatten the fixed side.
Capital intensity. Because of the large asset base, the weight of depreciation is large, and this is a fixed cost, and moreover not a cash movement. It follows from the formula above: with a high fixed share, the break-even volume is also high.
Large inventory. Holding tied-up inventory costs money, as a rule of thumb roughly 25 percent of the product value per year, and reducing it gives both a repeating capital-cost saving and a one-off cash impact. The worked example is in the working capital and cash-conversion cycle article.
Turnaround. The cost of a major overhaul is typically capitalized and written off over the next cycle. Deferral flatters the cost line and rolls the risk forward.
How do you turn a plant improvement into contribution?
Section titled “How do you turn a plant improvement into contribution?”Seven steps, in this order:
- Determine the volume or consumption effect in natural units (tons, operating hours, GJ, labor hours). The plant knows this, controlling does not.
- Choose the right cost base: the variable cost of the marginal supplier, not the weighted average price.
- Multiply by the unit contribution. The potential of the recovered volume is the sum of the contribution and the lost direct cost: 1,000 tons at 170 EUR/t contribution and 90 EUR/t direct cost is 260,000 EUR a year (illustrative).
- Decide which direct cost item counts: only the one that cannot be recovered on reprocessing, or that is consumed on a time basis.
- Separate the one-off and the repeating effect. An inventory reduction gives both; do not add them together.
- Compute with an annual change in consumption, not with a specific. At a different production level the specific difference is wrong.
- Carry it through to the income statement line. If the number cannot be tied to a line, it is not a benefit, only a hope.
Hands-on: the contribution of two products
Section titled “Hands-on: the contribution of two products”A proven workshop exercise works with two products.
Part 1 (calculation). Given the net revenue, feedstock cost and further variable cost of two products. Calculate the added-value ratio and the contribution margin for each, then the company level on the sum of the two. Question: which product covers proportionally more fixed cost?
Part 2 (comparison). Compare with the metrics of another company: the one that covers proportionally more fixed cost has more profitable products. The trap: at the end, ask whether it is worth investing in the other company on this basis. The right answer: you cannot decide on a single metric, further analysis is needed.
Homework. Run an improvement idea from your own area through the seven steps: the volume effect, the cost base, the one-off and repeating effect separately, and the income-statement line affected.
Measurement and audit: what to check in a contribution calculation
Section titled “Measurement and audit: what to check in a contribution calculation”| Check question | What you are looking for |
|---|---|
| Which cost base? | marginal variable cost, not average; which supplier’s |
| What time horizon? | are the “fixed” items fixed in the period examined |
| Is there a capacity limit? | is the volume within the current capacity |
| One-off or repeating? | the two separated, not added |
| Who accepted the number? | the controlling partner named, with a date |
The contribution margin and capacity utilization should go together onto the performance board; the discipline of the definitions comes from the KPI definition, the debate from the performance dialogue.
Common mistakes
Section titled “Common mistakes”- A saving computed on the weighted average price. Why it’s a problem: the average price embeds the fixed cost that cannot be saved, and the benefit slides up. Instead: the variable cost of the marginal supplier.
- Reading contribution as profit. Why it’s a problem: there is profit only above the fixed cost. Instead: write out the profit condition too.
- “Saving” an allocated indirect fixed cost. Why it’s a problem: re-charging does not eliminate a real cost. Instead: call a saving only what actually disappears.
- Bringing in a sunk cost. Why it’s a problem: money already spent does not belong in the analysis, yet it is often what keeps a bad project alive.
- Treating a fixed cost as fixed forever. Why it’s a problem: you pay for unnecessary capacity for years. Instead: assign a time horizon to every fixed item.
- Appraisal at an internal accounting or transfer price. Why it’s a problem: it is the result of a negotiation, not economic reality. Instead: appraise at a market or marginal price.
When NOT to use it (the limits of the contribution view)
Section titled “When NOT to use it (the limits of the contribution view)”Contribution is a strong tool for short-term decisions within capacity. In four situations it is the wrong answer.
| Situation | Why not contribution | The right answer | |
|---|---|---|---|
| Long-term pricing, investment decision | in the long run every cost is variable; contribution excludes the fixed and the capital cost | full unit cost, netback price, discounted cash flow | |
| Volume beyond capacity | above capacity a new fixed cost appears in a step | recompute for the new capacity | |
| A shared bottleneck | the right ranking is not the highest contribution margin but the contribution per unit of the scarce resource | optimization by [[profit-per-hour.en | profit per hour]] |
| Safety, environmental investment | the payback threshold is not the decision criterion here | risk-based decision, [[kockazatkezeles.en | risk management]] |
Rule of thumb: contribution is the tool for the “what should we do with the current asset” question; not for the “what should we build” question.
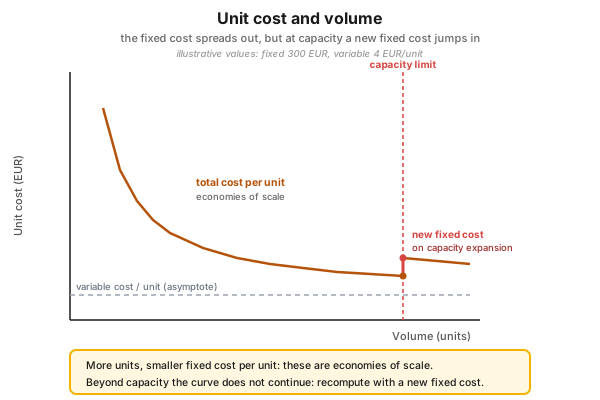
Figure 5 — the new fixed cost that enters at capacity: this is where the simple logic of economies of scale ends.
Take it home (keys)
Section titled “Take it home (keys)”- Ask for the contribution and the fixed cost separately. A proposal that contains only one of them cannot be appraised.
- Name the cost base in the first paragraph of your proposal: marginal variable cost, which supplier’s, for which period.
- Separate the one-off and the repeating effect. A one-off cash inflow is not an annual saving.
- Check the capacity before you extrapolate. Beyond capacity a new fixed cost enters.
- For a fixed cost, ask about its origin. A capacity introduced long ago for good reason often outlives its reason by decades.
Self-test
Section titled “Self-test”- A product’s price is 12 EUR/unit, its variable cost 7 EUR/unit, the fixed cost 45,000 EUR. What is the unit contribution, the contribution margin and the break-even point?
- Which cost base would you use to compute the benefit of an energy saving, and why not the annual average price?
- When is a fixed cost not fixed? Give two situations in which the classification changes.
Answer key: 1) Contribution = 5 EUR/unit; contribution margin = 5 / 12 = 41.7%; break-even point = 45,000 / 5 = 9,000 units. · 2) With the variable cost of the marginal supplier, because the average price also contains the fixed cost that the saving does not eliminate. · 3) Over a long time horizon and when capacity is crossed.
How does it show up in digital practice?
Section titled “How does it show up in digital practice?”Contribution calculation does not fail on the formula but on the data: without volume and specific consumption, even the best formula is an estimate.
| Element of contribution calculation | Digital implementation | What it delivers |
|---|---|---|
| Volume effect | volume and downtime capture per shift | the base does not come from memory |
| Off-spec and reprocessing | structured recording of the off-spec volume | it can be decided which cost is recoverable |
| Base of the variable cost | measuring specific material and energy use | the marginal base is measured, not assumed |
Connection to OPEREX (shift log)
Section titled “Connection to OPEREX (shift log)”The quantity side of contribution calculation originates shift by shift: downtime, off-spec volume, energy consumption, labor hours, inventory movement. The OPEREX shift log records these in a structured way, dated and with an owner, so the financial impact of an improvement can be derived after the fact from the same data on which the daily decisions were made.
Terminology (HU / EN / JP)
Section titled “Terminology (HU / EN / JP)”| Hungarian | English (canonical) | 日本語 / note |
|---|---|---|
| Fix (állandó) költség | fixed cost | 固定費 — payable even at zero output |
| Változó költség | variable cost | 変動費 — proportional to volume |
| Fedezet | contribution | 限界利益 — revenue minus variable cost |
| Fedezeti hányad | contribution margin | contribution / net revenue |
| Fedezeti pont | break-even point | 損益分岐点 |
| Hozzáadott érték | added value | net revenue minus feedstock cost |
| Bruttó fedezet | gross profit | revenue minus COGS |
| Netback ár | netback price | the minimum price that pays back every cost |
| Transzferár | transfer price | a negotiated internal price; not fit for economic appraisal |
What is contribution, and how does it differ from profit?
Contribution is net revenue minus variable costs, i.e. what is left to cover the fixed costs. Profit arises only when contribution exceeds the fixed cost, which is why contribution on its own is not profit.
How do I calculate the break-even point?
Fixed cost divided by the unit contribution. If the price is 10 EUR, the variable cost 4 EUR and the fixed cost 300 EUR, the unit contribution is 6 EUR and the break-even point is 50 units.
What is the difference between contribution and gross profit?
Contribution deducts the variable costs from revenue; gross profit deducts the direct cost of goods sold, which also contains fixed elements. This is why gross profit cannot be used to calculate the break-even point.
Why should a saving not be computed on the average price?
Because the weighted average price also embeds the fixed cost that the saving does not eliminate, so the benefit is overstated. The right base is the variable cost of the marginal supplier.
Related concepts
Section titled “Related concepts”the management report | the three financial statements | profit per hour | OEE | the energy-cost waterfall | production accounting and material balance | the KPI definition | muda | SMED | asset management (ISO 55000)
Next step
Section titled “Next step”- the three financial statements — where contribution and the fixed cost appear in the financial tables.
- profit per hour — contribution as an optimization objective, when the bottleneck decides.
- the energy-cost waterfall — the largest plant item of variable cost, broken into its elements.
References / further reading
Section titled “References / further reading”- Max S. Peters – Klaus D. Timmerhaus: Plant Design and Economics for Chemical Engineers. McGraw-Hill.
- AACE International Recommended Practice 18R-97: Cost Estimate Classification System for the Process Industries — the standard of the estimating accuracy classes.
- Eliyahu M. Goldratt – Jeff Cox: The Goal. North River Press, 1984 — the foundational work of the bottleneck view.
- IAS 2 Inventories (IFRS) — the normal-capacity-based allocation of fixed overheads.