Benefit calculation of improvements
≈ 18 min read · 3,554 words
You announce at the shift meeting that the new setpoint saves a day and a half of downtime a year, and controlling asks back: so how many euros is that, and where does it show in the statement? This is when it turns out that a good idea and an approved benefit are two different things. Benefit calculation does exactly this translation: it expresses the operational improvement in money, right where it actually shows up in the statement. Let’s look at where the benefit lands, what the difference is between hard and soft saving, and how we track it plan vs. actual.
Benefit calculation expresses an operational improvement’s impact in money through how it moves the income statement (P&L) and the balance sheet.
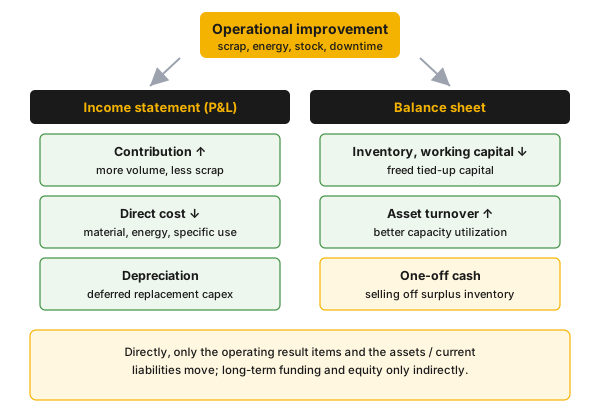
Figure 1 — where the benefit of an operational improvement lands in the income statement and the balance sheet.
Who is this for?
Section titled “Who is this for?”For those who submit, evaluate or execute improvements, and have to prove the benefit in money: plant manager · shift supervisor · process engineer · project manager · maintenance manager · reliability engineer · Lean/CI coordinator · buyer · controlling partner.
Learning objectives
Section titled “Learning objectives”After reading this article you will be able to:
- say where an operational improvement moves the income statement and the balance sheet;
- map five operational KPIs (OEE, efficiency, inventory, lead time, service) to financial impact, with a primary and a secondary link;
- distinguish hard and soft benefit, and justify why controlling credits the hard one;
- calculate an improvement’s benefit with a repeatable formula template;
- set up plan-actual tracking (baseline, target, actual, realization) and avoid double counting.
The essence
Section titled “The essence”- The benefit arises in the statement, not at the action: directly, only the operating items move — the P&L operating result lines and depreciation, and on the balance sheet the assets and the current liabilities.
- Five operational KPIs, five financial branches: OEE drives volume and contribution, efficiency the direct cost, inventory the tied-up capital, lead time and service the required inventory.
- Hard vs. soft: the hard one is booked into the statement, recurring and cash; the soft one is avoided cost or freed-up capacity, often one-off.
- The formula is repeatable: won volume × (contribution + non-recoverable direct cost), energy saving, and inventory reduction × cost of capital.
- Benefit lives on plan-actual tracking: baseline (Forecast-0), target (top-down and bottom-up), actual, realization, double counting excluded.
Why does it matter? The cost of non-credible benefit
Section titled “Why does it matter? The cost of non-credible benefit”Because what is not credibly turned into money, the organization does not build into the plan, and the improvement gets no funding. The stake is twofold. If you underestimate the benefit, the good action loses out in the ranking, and the capital goes elsewhere. If you overestimate or double count it, the plan promises a saving that never materializes, and your next submission is met with suspicion.
Where does the benefit land in the P&L and the balance sheet?
Section titled “Where does the benefit land in the P&L and the balance sheet?”In short: every financial impact analysis starts on the income statement and the balance sheet, because these two statements together give the company’s performance and value. An operational improvement directly moves only the operating items: in the P&L the operating result lines and depreciation, in the balance sheet the assets and the current liabilities. Long-term funding and equity move only indirectly.
The income statement is built top-down: revenue minus direct and administrative cost gives EBITDA, from which depreciation yields the operating result. The operational improvement acts directly down to the EBITDA line, and through depreciation it shows the longer-term impact of deferring investment.
Contribution is the most important handle: the product’s price minus all its variable cost. One extra unit produced and sold brings in its contribution, because the fixed cost is already covered; the detailed derivation of contribution and the break-even point is in the cost structure and contribution article. On the balance-sheet side, inventory reduction frees up tied-up capital and raises asset turnover, which has a positive effect on the return on capital; the logic of tied-up capital is laid out by working capital and the cash conversion cycle.
How can the five operational KPIs be mapped to financial impact?
Section titled “How can the five operational KPIs be mapped to financial impact?”Operational metrics become useful when you write next to each the primary and the secondary financial link: where the main impact is, and what the secondary consequence is. Five recurring KPIs and their mapping (Figure 2):
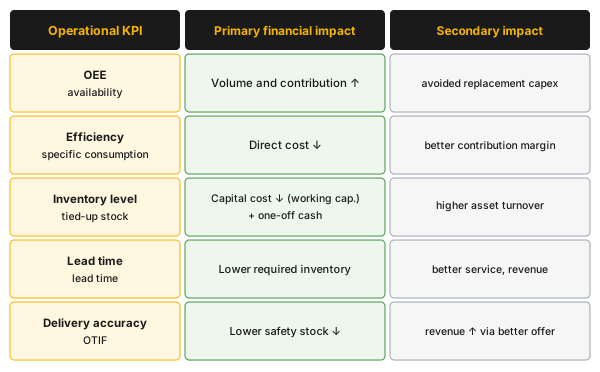
Figure 2 — the primary and secondary financial impact of the five operational KPIs.
- OEE / availability: higher equipment utilization brings more volume, hence more contribution. Secondarily, the capacity squeezed out of existing equipment can make a replacement investment unnecessary.
- Efficiency: improving specific consumption reduces direct production cost (material, energy), so it improves the contribution margin.
- Inventory level: less inventory frees up cost of capital and working capital, secondarily raises asset turnover; the eliminated surplus can also bring one-off cash.
- Lead time: a shorter lead time reduces the required inventory, and with better service indirectly helps revenue too.
- Delivery accuracy (OTIF): more reliable delivery requires less safety stock, and through a better value proposition can raise revenue.
The typical range is always set by your own plant’s data, not a standard. The full value-driver tree of the KPIs and their impact on return on capital is unfolded by the financial performance metrics and ROCE article; here the emphasis is on quantifying the benefit.
What is the difference between hard and soft benefit?
Section titled “What is the difference between hard and soft benefit?”The two kinds of benefit are not a ranking: both count, we just handle them differently. The boundary runs along measurability on the result line and along recurrence.
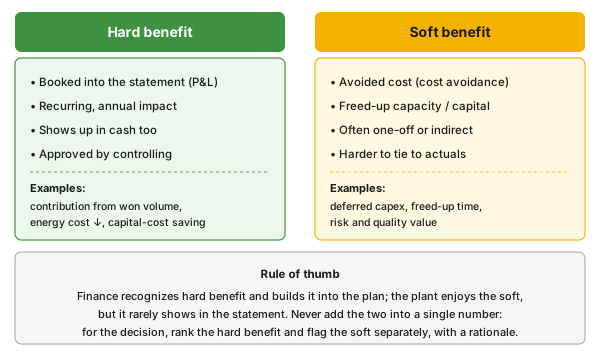
Figure 3 — the characteristics and examples of hard and soft benefit.
The distinction runs along the primary and secondary link, and along the one-off versus recurring impact. The characteristics of the hard benefit: it is measurable on the result line, recurs year after year, has a cash effect, and finance also recognizes it, so it can be built into the plan and the bonus logic. Such is the contribution of won volume, the reduced energy cost, or the lower cost of capital on freed-up capital.
The soft benefit is the other side: the avoided cost (cost avoidance), the freed-up capacity or capital, the value of better quality and service. It is often one-off (the one-off sale of surplus inventory) or indirect (a deferred investment), so it is harder to tie to actuals and to demonstrate in the statement.
How do you calculate an improvement’s benefit? A repeatable formula
Section titled “How do you calculate an improvement’s benefit? A repeatable formula”The core of benefit calculation is a few recurring formulas into which you substitute your own plant’s data. The logic is always the same: you multiply the physical improvement by the unit value belonging to it. The examples below work with neutral units (the real number comes from your own data).
1. Gain from won volume (less scrap or yield loss). The formula multiplies the annual won volume by the contribution, plus the direct production cost that cannot be recovered:
benefit = won volume × (contribution + non-recoverable direct cost)
The key is the second term in the bracket: count in only the direct cost that was permanently lost with the defective product. If the scrap can be reprocessed, the material cost is recoverable, so it does not belong in the benefit; if it was consumed on a time basis (for example the energy burned during the outage), then it does count in.
2. Gain from won availability. You convert the recovered production hours into volume with the average production rate, then calculate with the same contribution-plus-time-based-cost logic. This is the downtime-benefit branch.
3. Energy saving. The saving is the product of the power avoided and the annual energy quantity, and the unit price:
saving = power saved × annual energy quantity × unit price
4. The twofold benefit of inventory reduction. Inventory reduction saves a recurring cost of capital on one hand, and frees up one-off cash on the other:
recurring benefit = inventory reduction (in value) × cost of capital (WACC)
one-off benefit = surplus inventory sold × contribution
The cost of capital and the WACC are covered by the investment appraisal article. As a rule of thumb, holding inventory costs roughly one quarter of the product value per year (cost of capital, warehouse, handling, administration, insurance, obsolescence together). Physically reducing the surplus can happen by consuming the existing inventory, selling it commercially, or scrapping it.
What do you see of this in the management report?
Section titled “What do you see of this in the management report?”An improvement’s benefit becomes real in the monthly management report, not in the submission. Four lines that the operational leader also has visibility into.
| What you see in the report | What drives it in the plant | What you can do with it |
|---|---|---|
| realized vs. promised benefit | the improvement’s actual operational impact | you flag the gap early, before the project closes “as a success on paper” |
| recurring (run-rate) saving | the sustained new operating level | this is what gets built into next year’s plan, not the one-off impact |
| the variance of the affected result line | material, energy, maintenance cost | you see whether the benefit really shows up on the expected line |
| the benefit’s owner and deadline | the initiative tied to a responsible person | it is accountable, does not dissolve into the common pool |
The rule: track the benefit as long as it remains durably visible in the report relative to the baseline. An improvement is done when the saving has been built into the run-rate, not when the project is closed.
Process-industry and safety context
Section titled “Process-industry and safety context”In the process industry, benefit calculation often traces back to the margin: the loss from an outage or yield loss is the material-balance effect (the lost capacity for the days of the outage, corrected by the make-up after start-up) multiplied by the differential margin of the given period, not by the full product price. Variable and maintenance cost are typically not counted in, because the margin already captures the yield difference.
Four particularities arise:
- Base year and baseline: the benefit is always meaningful relative to a fixed baseline (for example the latest accepted plan, the “Forecast-0”); setting the baseline to a multi-year average makes the estimate more stable.
- Excluding double counting: if the yield improvement is already in the rolling plan, do not count it again as an improvement benefit.
- Safety takes priority: in a certified safety, regulatory or compliance project the benefit does not decide; there the calculation at most helps in selecting the cheapest compliant solution. Benefit calculation can never override a protective layer prescribed by a SIL/LOPA.
Introduction in practice
Section titled “Introduction in practice”In six steps you take an improvement’s benefit calculation all the way through:
- Set the baseline (baseline / Forecast-0): relative to what you measure the improvement.
- Identify where the benefit lands: on which P&L or balance-sheet item, with a primary and a secondary link.
- Choose the formula for the type of impact: volume, direct cost, energy or inventory.
- Calculate the benefit with your own operational data, on a margin basis, watching for non-recoverable cost.
- Classify into hard and soft benefit, and flag the soft one separately, with a rationale.
- Put it on tracking: target (top-down and bottom-up), actual, realization, double counting excluded.
Hands-on: calculate your own improvement’s benefit
Section titled “Hands-on: calculate your own improvement’s benefit”Mini-workshop, alone or in pairs. Take an improvement currently running in your own area (for example a setpoint that reduces scrap or energy use), fill in the fitting one of the four formulas above with your real data, and write in one sentence on which line of which statement the benefit appears.
Applied exercise, in a group. Build the benefit waterfall (Figure 4): from the starting result, stack the increments bucket by bucket (volume, quality, scrap, faster changeover) up to the target. The waterfall shows where the biggest potential is, and prevents you from presenting a single undifferentiated number.
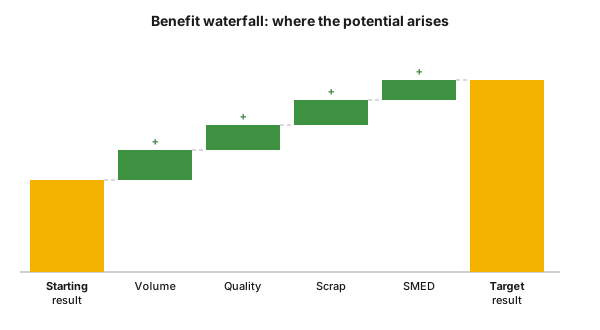
Figure 4 — the benefit waterfall breaks down bucket by bucket from the starting result to the target (the heights are schematic).
Plan-actual tracking: how do we verify the benefit?
Section titled “Plan-actual tracking: how do we verify the benefit?”Benefit calculation does not end with the estimate but with tracking the realization: whether the benefit promised on paper actually came in. Tracking stands on three steps (Figure 5): baseline, target, actual.
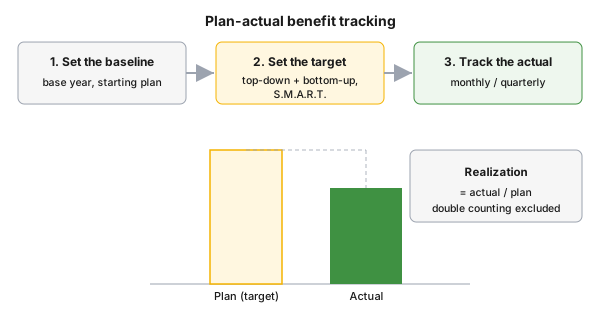
Figure 5 — the three steps of plan-actual benefit tracking and the realization.
Setting the target is two-directional. The top-down branch gives ambition from the top level (for the whole organization, then broken down to units), the bottom-up branch builds up the potential from the on-site review, from concrete initiatives; the two validate each other. The targets are S.M.A.R.T., and the initiatives are ranked by the size of the benefit and the feasibility.
Tracking the actual is a live KPI: the actual/plan ratio of the saving runs as a monthly and quarterly metric, built into the strategy deployment (for example into OGSM), with an owner and a deadline. The realization is the ratio of actual to plan: how much of the estimated benefit was achieved. Tracking discipline keeps at bay the two classic mistakes, double counting (measuring against the baseline and netting the make-up after start-up excludes exactly this) and the drift of the baseline.
Measurement and audit
Section titled “Measurement and audit”A benefit calculation is auditable when its input and its assumptions are traceable:
| Check point | What you look at | Why |
|---|---|---|
| Setting the baseline | is there a clear baseline (Forecast-0) | without it the “improvement” is not measurable |
| Pricing basis | does it calculate with contribution/margin, not the full price | the full price grossly overestimates |
| Non-recoverable cost | only the permanently lost direct cost | the reprocessable item is not a benefit |
The hard/soft classification and the exclusion of double counting are closed out by the Common mistakes section. The best learning tool is a simple, brand-free benefit sheet: you enter the physical improvement and the unit value, and the sheet outputs the benefit.
Common mistakes
Section titled “Common mistakes”- You price the won volume at the full sales price. Why it’s a problem: the fixed cost is already covered, only the contribution is the real benefit. Instead: calculate with contribution or differential margin.
- Double counting. Why it’s a problem: if the yield improvement is already in the rolling plan, you recognize it twice. Instead: measure against the baseline, and net the make-up after start-up.
- You book the soft as hard. Why it’s a problem: a saving that does not show up in cash gets into the plan. Instead: flag the soft benefit separately, with a rationale.
- “Improvement” without a baseline. Why it’s a problem: relative to what it got better cannot be decided. Instead: set a baseline (Forecast-0) before you calculate.
- Counting a sunk cost into the future benefit. Why it’s a problem: past spending does not influence the future cash flow. Instead: calculate only with the decision-dependent, future impact.
When NOT to use it?
Section titled “When NOT to use it?”Benefit calculation is powerful, but not every decision is decided by the benefit. Four situations where you should handle it with care:
| Situation | Why not primarily this | The right answer | |
|---|---|---|---|
| The benefit cannot be tied to a single action | multiple parallel effects, no clean attribution | measure against the baseline, not the action, and flag the uncertainty | |
| There is no stable baseline | the “improvement” is not reliably measurable | first set a baseline, only then calculate | |
| Purely strategic or option value | the present benefit does not capture the future flexibility | scenario and real-option thinking ([[opcioertekelo-matrix.en | option-value matrix]]) |
| Certified safety / regulatory reason | the risk is not priced by the return | mandatory-investment logic, cheapest compliant solution |
Rule of thumb: benefit calculation shows how much an improvement is worth in the statement, but it does not decide where the decision is set by safety, regulation or strategy. It is a decision-preparation frame, not investment advice.
Take it home (keys)
Section titled “Take it home (keys)”- Always start from the statement: say on which P&L or balance-sheet item the benefit appears.
- Price with margin, not the full price, and count only the non-recoverable direct cost.
- Separate the hard and the soft: plan the hard in, flag the soft separately, with a rationale.
- Set a baseline, and exclude double counting: if the benefit is already in the rolling plan, do not count it again.
- Track it plan vs. actual: target, actual, realization; the estimate is worth something only once verified.
Self-test
Section titled “Self-test”- An improvement brings a thousand more sellable units a year. Why is the full sales price of the units not the benefit, and what do you price it with instead?
- The yield won from the availability improvement already appears in the rolling plan. Can you account for it separately as an improvement benefit, and why?
- An inventory reduction gives a recurring and a one-off benefit at once. Which is closer to the hard, and which to the soft side?
Answer key: 1) Because the fixed cost is already covered, so the extra unit brings only its contribution; calculating with the full price you would grossly overestimate. · 2) No: this would be double counting, because the benefit is already in the plan; measured against the baseline it is neutral. · 3) The recurring cost-of-capital saving is hard (it shows in the statement year after year); the one-off sale of the surplus is rather a soft/one-off item that you flag separately.
How does it appear in digital practice?
Section titled “How does it appear in digital practice?”Benefit calculation stands or falls on its input: the saving is worth as much as it is traceable back to the operational data captured where it arose. The same baseline-target-actual logic is realized in software too, by a different mechanism, on the same principle.
| Element of benefit calculation | Digital implementation | What it delivers |
|---|---|---|
| Baseline | a fixed starting data series with a timestamp | what we measure against, traceably |
| Benefit input | operational yield, loss and energy data at the time it arises | the saving is source-faithful, not an after-the-fact estimate |
| Plan-actual tracking | structured tracking of target and actual, realization % | the benefit is verifiable, not merely promised |
| Filtering double counting | a record that accounts for one benefit in one place | there is no overlap with the plan |
| Auditability | a document and a timestamp for every input | an auditable business case |
Connection to OPEREX (shift diary)
Section titled “Connection to OPEREX (shift diary)”An improvement’s benefit side can be defended in a controlling debate or at an investment gate if there is an operational data series behind it. A digital shift diary (OPEREX) records the yield, the loss and the downtime shift by shift, with an owner and a timestamp; from this the improvement’s benefit can be derived independently of the monthly close, plan-actual, and auditably. This way the saving is not a shift-meeting anecdote but a source-faithful, trackable number.
Terminology (HU / EN / JP)
Section titled “Terminology (HU / EN / JP)”| Hungarian | English (canonical) | 日本語 |
|---|---|---|
| Haszonszámítás | benefit calculation | 便益計算 |
| Megtakarítás | savings | 節減 |
| Kemény haszon | hard benefit | ハードベネフィット |
| Puha haszon | soft benefit | ソフトベネフィット |
| Elkerült költség | cost avoidance | コスト回避 |
| Fedezet | contribution | 限界利益 |
| Fedezeti pont | break-even | 損益分岐点 |
| Terv-tény követés | benefit tracking | ベネフィットトラッキング |
| Realizáció | realization | 実現率 |
| Bázisév / baseline | base year / baseline | 基準年 |
Where does the benefit of an operational improvement land?
In the income statement on the operating result lines and depreciation, in the balance sheet on the assets and the current liabilities. Long-term funding and equity move only indirectly, which is why every impact analysis starts on these two statements.
How do I avoid double counting?
Set a clear baseline (baseline / Forecast-0), and measure the benefit against it. If the improvement already appears in the rolling plan, do not count it again as an improvement benefit; and net the make-up after start-up so the same volume does not show up twice.
Why do we price the won volume with the contribution, not the full price?
Because the fixed cost has already been recovered in the existing production, so the real benefit of the extra unit is its contribution: its price minus its variable cost. Calculating with the full sales price you would grossly overestimate the saving.
Who credits the benefit?
Controlling recognizes the hard benefit, because it is a measurable, recurring cash effect attributable to a single action that can be built into the plan. The soft benefit is worth presenting separately, with a rationale, but must not be added to the hard number.
Related concepts
Section titled “Related concepts”cost structure and contribution | financial performance metrics | investment appraisal (DCF/NPV/IRR) | working capital and the cash conversion cycle | the three financial statements | financial vs. management reporting | OEE | profit per hour | OGSM | kaizen
Next step
Section titled “Next step”From here it is worth going on, in this order:
- cost structure and contribution — contribution and the break-even point, from which every formula of benefit calculation starts.
- financial performance metrics — how return on capital breaks down into operational KPIs, with the full value-driver tree.
- investment appraisal (DCF/NPV/IRR) — how the multi-year benefit becomes NPV, IRR and payback in an investment decision.
References / Further reading
Section titled “References / Further reading”- Robert S. Kaplan & Anthony A. Atkinson: Advanced Management Accounting. Prentice Hall — the foundational work of decision-oriented management accounting and the contribution approach.
- Charles T. Horngren, Srikant M. Datar & Madhav V. Rajan: Cost Accounting: A Managerial Emphasis. Pearson — the canonical textbook of fixed and variable, direct and indirect cost, and contribution analysis.
- IAS 2 — Inventories (IASB) — the international accounting framework for inventory valuation, as background for the benefit side of inventory reduction.