Investment appraisal: DCF, NPV, IRR
≈ 18 min read · 3,577 words
You are offered a deal: invest 2000 today, and over the next three years get back 500, then 1500, then 1000. A total of 3000 flows back instead of 2000, so a winning deal? The answer is not that simple, because a unit promised for the future is worth less than one today, and the capital you tie up also has a price. Investment appraisal is exactly what makes this measurable. Let’s look at what NPV, IRR and the payback period show, and why the cost of capital is the discount rate.
Investment appraisal discounts future cash flows to present value (DCF): if NPV is positive, the project earns above its cost of capital and creates value.
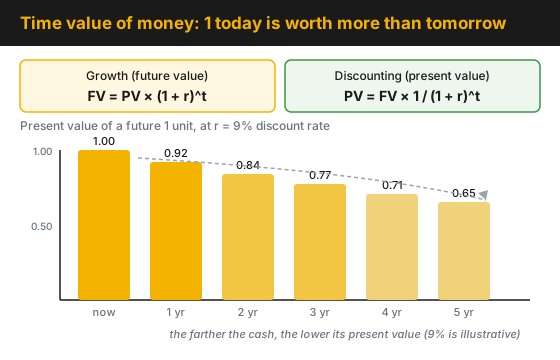
Figure 1 — the time value of money: the more distant the cash flow, the lower its present value, because the discount factor pulls it back.
Who is this for?
Section titled “Who is this for?”For those who submit or appraise a project without being finance people: plant manager · shift supervisor · process engineer · project manager · maintenance manager · reliability engineer · investment engineer · buyer · Lean/CI coordinator.
Learning objectives
Section titled “Learning objectives”After reading this article you will be able to:
- draw the cash flow diagram of a project, with the sunk cost excluded;
- discount the cash flows and compute the NPV at a given rate;
- interpret the IRR and compare it with the hurdle rate;
- decide when NPV, when IRR and when payback is the right decision rule.
In brief
Section titled “In brief”- The time value of money is the starting point: a future unit is worth less than one today, so you discount every cash flow to present value.
- NPV decides: if the sum of the discounted receipts and payments is positive, the investment earns above the cost of capital.
- IRR ranks, but carefully: the highest IRR is not the largest NPV, and it hides the project size.
- Payback is a risk signal, not a decision-maker: it ignores the timing and the cash beyond payback.
- The discount rate is the cost of capital: the WACC is the threshold below which the NPV is negative.
- Garbage in, garbage out: the number is worth only as much as the cash flow diagram and the assumptions behind it.
Why does it matter? The cost of poorly ranked capital
Section titled “Why does it matter? The cost of poorly ranked capital”Because capital is scarce and projects compete for it: every project is a mini-company that must justify the limited CAPEX with its own cash flow. If the decision is made without discounting, on the bare “how much flows back” basis, three traps open: a value-destroying project also looks good, the ranking goes wrong (the seemingly higher-return one comes first, though the other creates more value), and unpriced risk treats an uncertain, distant cash flow exactly like a certain one.
How do you decide whether an investment is worth it?
Section titled “How do you decide whether an investment is worth it?”In short: you discount every future cash flow to present value with the cost of capital, add them up, and the NPV makes the decision (a positive NPV means production above the required return on capital). The IRR gives the same thing as a percentage against the hurdle rate, and the payback period signals the risk. This is the discounted cash flow (DCF) method: NPV decides, IRR and payback add nuance.
What is the time value of money and discounting?
Section titled “What is the time value of money and discounting?”The time value of money means that one unit today is worth more than the same unit a year from now, because today’s money can earn interest in the meantime. That is why amounts due at different times are comparable only once brought to a common point in time, typically the present. You can move in two directions: forward, the future value takes you (a deposit of 100 units at 10% a year becomes 110 in one year, 121 in two); backward, discounting brings the present value.
FV = PV × (1 + r)^t and PV = FV × 1 / (1 + r)^t
The 1 / (1 + r)^t is the discount factor: it pulls future money back to present value (Figure 1). The more distant the cash flow and the higher the rate, the smaller the factor. If interest compounds several times a year, the effective return rises: the formula then carries (1 + r/N)^(N×t), where N is the number of compounding periods per year.
How do you draw the cash flows? The cash flow diagram
Section titled “How do you draw the cash flows? The cash flow diagram”The cash flow diagram is the most fundamental tool of financial analysis: it draws which costs and benefits arise, and when, over the life of the project. No good decision comes from a bad diagram, however fast the spreadsheet computes.
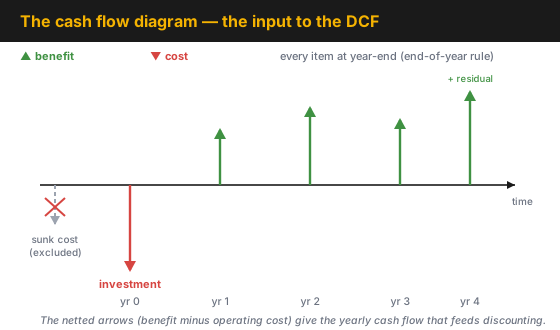
Figure 2 — the conventions of the cash flow diagram: costs point down, benefits point up, the sunk cost excluded.
The convention is simple: the horizontal axis is time, a downward arrow marks a cost and an upward arrow a benefit, and every item falls at the end of the period (this is the “end-of-year” rule). Two things matter. The sunk cost must be excluded: money spent before time zero is irrelevant to the decision, and you must not continue a loss-making project because you have already put a lot into it (“don’t throw good money after bad”). By contrast, the opportunity cost you give up with a decision is the real cost of that decision.
What is net present value (NPV), and when do you accept the project?
Section titled “What is net present value (NPV), and when do you accept the project?”The NPV is the sum of all the project’s cash flows discounted to present value, at a given discount rate. The decision rule is one sentence: if the NPV is positive, the investment creates value and can go ahead; if it is negative, it must be rejected. A positive NPV means the return exceeds the cost of capital.
The introductory example, with a 2000 initial investment, then cash flows of 500, 1500 and 1000, discounted at 9%:
| Year | Cash flow | Discount factor (9%) | Present value |
|---|---|---|---|
| 0 | −2000 | 1.000 | −2000 |
| 1 | +500 | 0.917 | +459 |
| 2 | +1500 | 0.842 | +1262 |
| 3 | +1000 | 0.772 | +772 |
| NPV | +493 |
The discounted total is +493, hence positive: the project earns above the 9% cost of capital (Figure 3). The undiscounted “3000 minus 2000 = 1000” would have given a quite different, distorted picture.
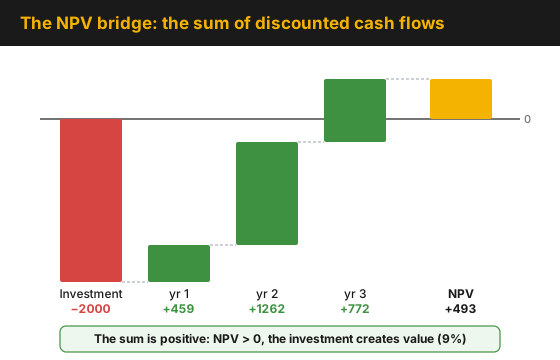
Figure 3 — the NPV bridge: the sum of the negative initial investment and the positive, discounted yearly cash flows is the net present value.
NPV is the “right” metric when capital is not constrained: this is what you maximize. Its single weakness is that it does not relate the benefit to the project size.
What is the internal rate of return (IRR) and the hurdle rate?
Section titled “What is the internal rate of return (IRR) and the hurdle rate?”The IRR is the discount rate at which the NPV of all the project’s cash flows is exactly zero: the return the project generates on its own, independent of the cost of capital. The IRR of the example above is 21%, at which rate the +493 NPV is drawn precisely to zero (Figure 4).
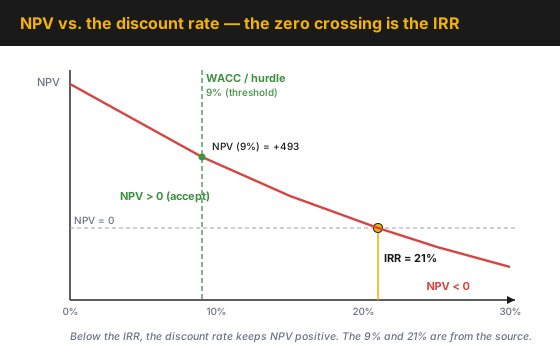
Figure 4 — the NPV falls as the discount rate rises; the zero crossing is the IRR, and the WACC is the threshold below which the NPV is positive.
You measure the IRR against the hurdle rate, the minimum acceptable rate of return (its synonym is the MARR). Whatever falls below the hurdle must be rejected; but the reverse is not true: not every above-hurdle project goes ahead, because capital is finite. The IRR is independent of the project size, so it seems to rank well, but that is exactly its trap.
There is a technical pitfall too: if the sign of the cash flow changes more than once, the formula can have several solutions, and the IRR becomes uninterpretable; then the NPV is the reliable metric.
What is the payback period and the discounted payback?
Section titled “What is the payback period and the discounted payback?”The payback period measures how long it takes the cumulative cash flow to reach zero. The simple payback works with the undiscounted cash flow: in the example the −2000 reaches zero after the year-1 +500 and the year-2 +1500, so the payback is 2 years. The discounted payback looks at the same with discounted cash flow, so it is always longer, but more realistic.
Payback is a quick, intuitive, good approximate measure of risk and liquidity. But it does not see two things: the timing (the simple version) and the cash flow beyond payback (both). That is why it can never decide on its own; it only stands alongside the other metrics.
Why is WACC the discount rate?
Section titled “Why is WACC the discount rate?”Because the capital that finances the investment has a price, and the discount rate must reflect it. The weighted average cost of capital (WACC) is the minimum return the company must earn to serve its lenders and its owners. This is the threshold below which the NPV is negative.
WACC = (share of equity × cost of equity) + (share of debt × cost of debt × (1 − tax rate))
The debt part is reduced by the tax shield (1 − tax rate) because interest is tax-deductible. From the WACC comes the capital charge: the tied-up capital × WACC is the annual cost of financing. A project creates value if its return is above this threshold.
Comparing the methods — which one when?
Section titled “Comparing the methods — which one when?”There is no single “best” metric: each measures something different, and the right choice depends on the nature of the decision. The matrix below compares five methods by whether they discount, whether they are size-independent, and what their decision rule is.
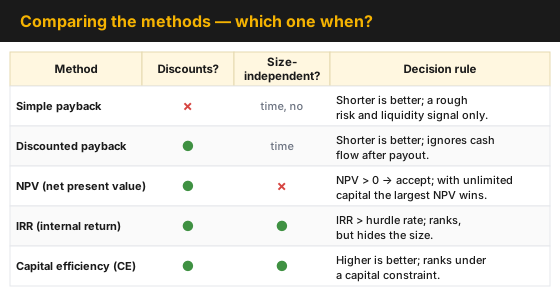
Figure 5 — the comparison matrix of the methods.
Payback measures in time, but the simple version does not discount; NPV discounts and decides, but is size-dependent; IRR is size-independent, only it hides the size. Capital efficiency (CE) relates the project’s NPV to the present value of the investment: it tells how much value one unit of tied-up capital creates (in one teaching example, an NPV of 50 / an investment of 104.9 = 47.7%). This is strong where NPV is weak: it ranks under a capital constraint. NPV tells you whether it is worth it, CE tells you which is worth more.
What do you see of this in the management report?
Section titled “What do you see of this in the management report?”The investment does not end with the decision: in the management report you track whether the value promised on paper was realized. Four lines the plant manager also has a view of.
| What you see in the report | What drives it | What you can do with it |
|---|---|---|
| approved CAPEX vs. actual | the investment estimate in the proposal | flag the slippage and overrun early, before it eats the return |
| hurdle rate (WACC) | the corporate cost of capital | the threshold the project’s IRR must not fall below |
| actual vs. planned return (post-appraisal) | the real cash flow after start-up | you feed a lesson into the next proposal |
| sensitivity band | feedstock price, capacity, investment cost | you know which assumption tips the decision |
The rule: confront the pre-approval estimate with the actual after start-up (post-audit); this is how the loop the proposal opened is closed.
Process-industry and safety context
Section titled “Process-industry and safety context”In the process industry investment appraisal is the decision frame of the development gates (gate, investment proposal): a new plant, a capacity increase or a debottlenecking stands or falls on NPV and IRR. Four particularities:
- Life cycle cost: DCF over the asset’s whole life, the discounted sum of the investment, the energy, the maintenance and the decommissioning.
- Depreciation: the write-off method shapes the net, after-tax cash flow through the tax base.
- Sensitivity analysis: varying the feedstock price, the capacity and the investment cost shows how robust the decision is.
- Incremental economics: for alternatives, look at the differences, and at the annual change in consumption, not the specific one.
Certified safety and regulatory projects go ahead even below the hurdle rate (see below, “When NOT to use it?”, and reliability-centered design): there the DCF answers not “is it worth it,” but “which is the cheapest compliant solution.”
Introduction in practice
Section titled “Introduction in practice”You carry the appraisal of a project through in seven steps:
- Draw the cash flow diagram, with the sunk cost excluded.
- Net the yearly cash flow: benefit minus operating cost, with the effect of tax and depreciation.
- Choose the discount rate: the cost of capital (WACC), and write down how large it is.
- Discount and sum: compute the NPV with the discount factors.
- Compute the IRR and the payback for the ranking and the risk judgment.
- Run a sensitivity: see where the NPV turns negative.
- Make the decision with the NPV, alongside the IRR and the payback, ranking with capital efficiency under a capital constraint.
Hands-on: calculate it yourself
Section titled “Hands-on: calculate it yourself”Contrast workshop, in pairs. Appraise a project first without DCF (the bare “how much flows back”), then the same one with DCF, discounted at 9%. The difference shows what dropping discounting distorts.
Applied task, alone. Of two projects, A has an IRR of 17.9%, B of 36.6%. Compute the NPV of each at 9% and their capital efficiency, and decide which you would choose under a capital constraint, and why.
Measurement and audit
Section titled “Measurement and audit”An appraisal is auditable when its input and its assumptions are traceable:
| Check point | What you look at | Why |
|---|---|---|
| Completeness of the cash flow diagram | every cost/benefit in its place | an incomplete diagram gives a wrong NPV |
| Sunk cost | whether the pre-zero spend was excluded | the past must not distort the decision |
| Timing convention | whether it is uniform (year start / middle / end) | the convention itself affects the NPV |
| Discount rate | whether it is the cost of capital, written out | a wrong rate is a wrong decision |
| Sensitivity | whether it was run on the key assumptions | the robustness is the measure of the risk |
The best learning tool is a simple, brand-free NPV/IRR/payback table: you enter the cash flows year by year, compute the discount factor from the rate, and the table outputs the three metrics.
Common mistakes
Section titled “Common mistakes”- Counting the sunk cost. Why it’s a problem: past spend does not affect future cash flows. Instead: compute only with the post-zero, decision-dependent cash flow.
- A decision on undiscounted payback. Why it’s a problem: it does not see the timing and the cash beyond payback. Instead: payback is a risk signal; decide with the NPV.
- An IRR ranking without size. Why it’s a problem: the highest IRR is often a small project’s, with little value created. Instead: rank with NPV and capital efficiency.
- A specific (not annual) change in consumption in an incremental analysis. Why it’s a problem: at a different production level it is wrong. Instead: compute with the difference of the full annual consumptions.
- An unwritten discount rate. Why it’s a problem: the NPV is sensitive to the rate, and becomes incomparable. Instead: use the cost of capital, and write down how large it is.
- A single-assumption model. Why it’s a problem: “garbage in, garbage out” — a pretty NPV from bad input is worth nothing. Instead: run a sensitivity.
When NOT to use it?
Section titled “When NOT to use it?”DCF is powerful, but not for every decision. Four situations where you should handle it with care:
| Situation | Why not primarily this | The right answer | |
|---|---|---|---|
| Certified safety / regulatory project | the risk is not priced by the return | mandatory-investment logic, cheapest compliant solution | |
| Cash flow with multiple sign changes | the IRR can have several solutions | NPV and sensitivity, without IRR | |
| Very uncertain, distant forecast | the error is large, discounting does not save it | scenario and real-option thinking ([[opcioertekelo-matrix.en | the option-evaluation matrix]]) |
| Daily, shift-level optimization | the DCF is project-scale | operational metrics, [[profit-per-hour.en | profit per hour]] |
Rule of thumb: DCF tells you whether a project earns above its cost of capital, but it does not decide where the decision is set by risk, regulation or strategy. It is a decision-preparation frame, not investment advice.
Take it home (keys)
Section titled “Take it home (keys)”- Always start with a cash flow diagram, and exclude the sunk cost.
- Discount with the cost of capital, and write the rate next to the number.
- NPV decides, IRR and payback add nuance: the positive NPV is the threshold.
- For a ranking, look at the size: the highest IRR is not the largest value; under a capital constraint, capital efficiency helps.
- Run a sensitivity: the robustness says more than a single pretty number.
Self-test
Section titled “Self-test”- A project’s cash flow: year 0 −1000, year 1 +600, year 2 +600. What is the simple (undiscounted) payback period?
- Why might you choose the other project instead of the one with the higher IRR?
- A project’s IRR is 12%, the corporate cost of capital is 9%. Is the project acceptable, and what does the sign of the NPV show in this case?
Answer key: 1) −1000 + 600 = −400 after the first year, from the second 600 another 400 is needed, so the payback is roughly 1.7 years. · 2) Because the IRR hides the size: the smaller, higher-IRR project can create less NPV than the larger, lower-IRR one; under a capital constraint capital efficiency decides. · 3) Yes: the IRR (12%) is above the cost of capital (9%), so the NPV computed at 9% is positive.
How does it show up in digital practice?
Section titled “How does it show up in digital practice?”Investment appraisal stands or falls on its input: the benefit estimate is worth only as much as it is traceable back to the operating data recorded at the point of origin.
| Concept | Digital implementation | What it delivers |
|---|---|---|
| Input to the cash flow | operating yield, loss and downtime data with a timestamp | a traceable source for the benefit estimate |
| Investment register | CAPEX and cash flow per project, structured | a uniform, comparable NPV/IRR |
| Sensitivity | a parameterizable model of the key assumptions | a quick recomputation of the robustness |
| Auditability | a voucher and timestamp for every input | a verifiable business case |
Connection to OPEREX (shift log)
Section titled “Connection to OPEREX (shift log)”The benefit side of a project can be defended at an investment gate only if there is an operating data series behind it. A digital shift log (OPEREX) records the yield, the loss and the downtime shift by shift, with an owner and a timestamp; from this the project’s annual cash flow, the input to the DCF, can be derived auditably, independent of the monthly close.
Terminology (HU / EN / JP)
Section titled “Terminology (HU / EN / JP)”| Hungarian | English (canonical) | 日本語 |
|---|---|---|
| Beruházásértékelés | investment appraisal | 投資評価 |
| Pénz időértéke | time value of money | 貨幣の時間価値 |
| Diszkontált pénzáram (DCF) | discounted cash flow | 割引キャッシュフロー |
| Diszkontálás / diszkontfaktor | discounting / discount factor | 割引 / 割引係数 |
| Nettó jelenérték (NPV) | net present value | 正味現在価値 |
| Belső megtérülési ráta (IRR) | internal rate of return | 内部収益率 |
| Megtérülési idő | payback period | 回収期間 |
| Diszkontráta | discount rate | 割引率 |
| Tőkeköltség (WACC) | weighted average cost of capital | 加重平均資本コスト |
| Hurdle rate (MARR) | hurdle rate / minimum acceptable rate | ハードルレート |
| Tőkehatékonyság | capital efficiency | 資本効率 |
| Elsüllyedt költség | sunk cost | 埋没費用 |
What is the difference between NPV and IRR?
The NPV is the sum of the discounted cash flows expressed in money: it tells how much value the project creates above the cost of capital. The IRR gives the same return as a percentage: the discount rate at which the NPV is zero. NPV decides, IRR ranks, but it hides the size.
What counts as a good payback period?
There is no universal number: payback signals risk and liquidity, not value. A shorter payback means lower risk, but the decision must be based on the NPV, because payback does not see the timing and the cash flow beyond payback.
Where does the discount rate come from?
From the cost of capital. The weighted average cost of capital (WACC) is the weighted average of the cost of equity and debt, corrected by the tax shield. It is the minimum return that must be earned; below it the NPV is negative.
Related concepts
Section titled “Related concepts”financial metrics and ROCE | working capital and the cash-conversion cycle | cost structure and break-even point | the three financial statements | financial vs. management reporting | the option-evaluation matrix | profit per hour | asset management (ISO 55000) | reliability-centered design
Next step
Section titled “Next step”From here it is worth going on, in this order:
- financial metrics and ROCE — the single-period value-creation test (return above the cost of capital), of which the DCF is the multi-period version.
- working capital and the cash-conversion cycle — why inventory and receivables are tied-up capital, and how the cost of capital charges them.
- the option-evaluation matrix — how to decide under high uncertainty, when the rigid DCF is no longer enough.
References / further reading
Section titled “References / further reading”- Abol Ardalan: Economic and Financial Analysis for Engineering and Project Management. Technomic Publishing, 2000 (ISBN 1-56676-832-2).
- Franklin J. Stermole & John M. Stermole: Economic Evaluation and Investment Decision Methods. Investment Evaluations Corporation.
- IAS 36 — Impairment of Assets (IASB) — asset impairment at the present value of the expected future cash flow.