The Diagnose phase — measuring the current state in a Lean transformation
≈ 17 min read · 3,394 words
A good doctor does not prescribe medicine before examining the patient; a competent mechanic does not swap parts until they have located the fault. It would be strange the other way around, yet in organizational development this is precisely the most common wrong turn: we plunge into the solution before we know what the real problem is. The diagnostic (Diagnose) phase of a Lean transformation prevents this. Its guiding principle fits in a single sentence: measure first, plan after. Let’s look at what it examines, what its output is, and why it is worth the time.
The diagnostic (Diagnose) phase is the data-gathering stage of a Lean transformation: measuring the current state before designing the solutions. The diagnosis examines three dimensions at once: the lens of the Operating System (process), the Management Infrastructure (management systems), and Mindset & Behaviours (thinking and behaviour). Its output is the shared, fact-based picture of the current state, that is, the baseline, onto which the following phases (Design, Plan) build the solution and the tactical plan (TIP). Its simple ground rule: the diagnosis answers the “what” question, the “how” only comes afterward.
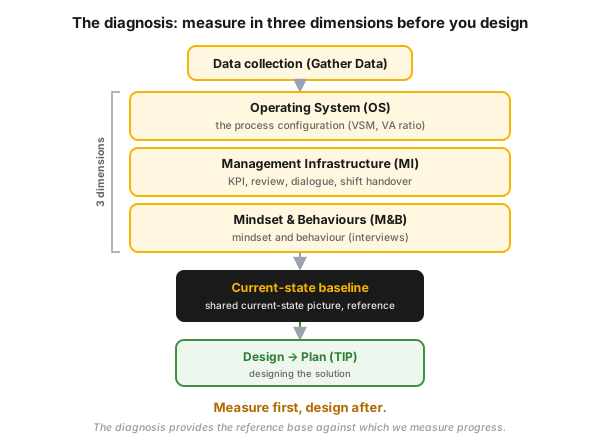 Figure 1 — the logic of the diagnosis: data collection measures three dimensions, from these the current-state baseline is assembled, and only on this is the design of the solution (Design) and the tactical plan (TIP) built.
Who is this for?
Section titled “Who is this for?”This article is for those working on assessing the current state in a Lean or Operational Excellence transformation, or using its results: production and plant manager · shift supervisor · process technologist · process engineer · Lean/CI specialist (navigator) · reliability engineer · energy manager · HSE.
Learning objectives
Section titled “Learning objectives”After reading this article you will be able to:
- explain why you must measure first, plan after, and what you risk if you skip the diagnosis;
- list the three dimensions of the diagnosis (OS / MI / M&B), and say which one examines what;
- distinguish the “what” (Diagnose) from the “how” (Design, Plan) question, and recognize the most common mistake, when the two get blurred together;
- describe what the output of the diagnosis is (the current-state baseline), and how it hands the baton on to the Design and Plan phases;
- outline, for a concrete workstream (e.g. energy and yield), what analyses make up a data-driven diagnosis.
The essence
Section titled “The essence”- The diagnosis is the data-gathering stage of the transformation: uncovering the current state and the root causes before we plan anything.
- It looks at three dimensions at once: Operating System (the process), Management Infrastructure (the management systems), Mindset & Behaviours (thinking and behaviour): the three lenses of Lean.
- The sequence is fixed: the diagnosis measures the what; the how (the solution) belongs to the Design and Plan phases. Blurring the two is the most common mistake.
- The output is the current-state baseline: a shared, fact-based picture against which we measure later progress (impact).
- From the baseline comes the Tactical Implementation Plan (TIP), the per-workstream tactical plan that drives the rollout.
- The analysis works with concrete tools: a data masterfile, a root-cause tree (intervention tree), a load curve, interviews, benchmarking. The goal is not the quantity of data, but finding the potential.
Why it matters (the stakes)
Section titled “Why it matters (the stakes)”Skipping the diagnosis is expensive because even a perfect solution to the wrong problem is wasted work. If you have not measured the current state, you risk three things at once.
- You solve the wrong problem. You plan on an assumption, not on fact data; the solution misses, and the real loss remains.
- You cannot prove the impact. Without a baseline there is no reference point, so the “improvement” is unmeasurable, and support for the program quickly runs out.
- It will not be sustainable. If you look only at the technique and skip the management system and the behaviour, the change reverts as soon as attention turns away.
The lesson is the same as in the medical analogy: the diagnosis is not the slowdown, but the avoidance of fast steps in the wrong direction. A well-timed assessment scoped to two weeks saves the months you would otherwise spend patching up a poorly targeted solution.
What does the diagnostic phase examine? (the three dimensions)
Section titled “What does the diagnostic phase examine? (the three dimensions)”The diagnosis measures three dimensions at once, not just the technical process: the lens of the Operating System, the Management Infrastructure, and Mindset & Behaviours. This trio is the three lenses of Lean; the point is that for a lasting change all three must be mapped, otherwise the solution stands on one leg.
| Dimension | What it examines | Typical diagnostic tool | |
|---|---|---|---|
| Operating System (OS) | the configuration of the process: how value flows, where the loss is | [[vsm.en | value stream map]], value-adding ratio (VA), load curve |
| Management Infrastructure (MI) | the management systems: how we measure and steer | KPI audit, review and [[muszakatadas.en | shift handover]] observation, diagnostics of the management system |
| Mindset & Behaviours (M&B) | thinking and behaviour: how people work and decide | operator observation, expert and operator interviews, survey |
How does a diagnosis run? (Gather Data → current state)
Section titled “How does a diagnosis run? (Gather Data → current state)”The diagnosis is structured data collection, not free contemplation. A well-run assessment goes roughly through these steps, always moving from the facts toward the root cause. The steps start with verbs, because the diagnosis too is work, not passive reading.
- Collect the current-state data. A tidy data masterfile per unit: the main indicators, the units of measure, the source tags, and next to every number the method of calculation (there should be no “hard-wired,” unexplainable value).
- Record the baseline together with the reasons. For every main indicator, note what the starting value is and why (measurement limit, operating mode, shutdown). A baseline without its reasons misleads.
- Break down the loss (root-cause tree). Build an intervention tree / KPI–PI–I breakdown for the main indicators: which piece of equipment, which operation contributes how much to the loss (Pareto logic). This shows where the big impact is.
- Draw and evaluate the current-state curves. Where the process’s performance depends on the load, the load curve shows the variability and the potential (see Figure 2). Every large scatter is a “Why?” closed off by root-cause analysis.
- Talk to the people (interview, observation). Observing and interviewing the control-room and outdoor operators reveals the real practice and the hidden human intervening variables. This is the terrain of the M&B and MI dimensions.
- Compare against the benchmark. Compare the current state with peer performance and the theoretical minimum; the root causes behind the gaps give the high-impact opportunities.
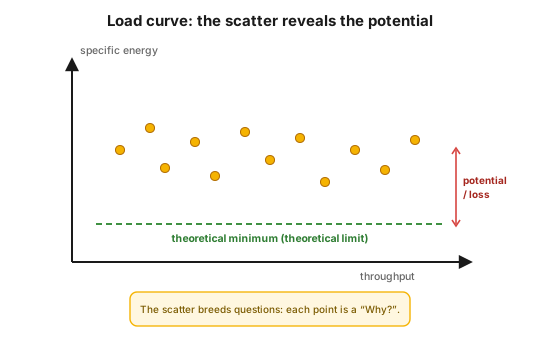 Figure 2 — the load curve as a diagnostic tool: the pairs of specific consumption and throughput form a scattered cloud. The scatter is the variability (and the potential), the theoretical minimum is the target; the gap between the two is the graspable loss.
What is the output of the diagnosis, and where does it fit?
Section titled “What is the output of the diagnosis, and where does it fit?”The output of the diagnosis is the current-state baseline: a shared, fact-based picture on which the team and the management agree that “this is where we are now.” This baseline is the reference point against which we will measure the transformation’s later impact, and it is the raw material from which the following phases work.
The diagnosis is the transformation journey’s first “P” phase: it delivers the what. After it, Design sets the future state and the structure of the indicators (KPI–PI–I), and Plan produces from this the Tactical Implementation Plan (TIP), the per-workstream tactical plan that drives the rollout. The full journey (from preparation to sustainment, pilot and waves) is a separate topic: see the Lean transformation journey hub; this article focuses on the Diagnose phase.
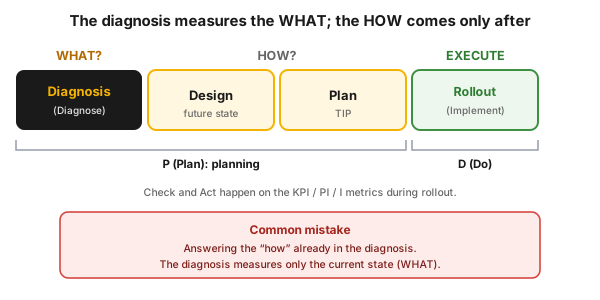 Figure 3 — the diagnosis measures the
what (WHAT) question; the how (HOW) is the job of Design and Plan, and the execution (EXECUTE) belongs to the Implement phase. The diagnosis–design–plan together are the “Plan” part of PDCA. The common mistake: answering the how already in the diagnosis.
Process-industry context: an energy- and yield-diagnosis
Section titled “Process-industry context: an energy- and yield-diagnosis”In a process-industry complex the diagnosis is typically broken into workstreams, and the current state is built up from the existing plant data (historian, energy and material balance). A good example is an energy- and yield-workstream (Energy & Yield): here you can see clearly what the three dimensions look like in practice.
- Data collection per unit. A masterfile for each unit: the energy types used (consumer and producer) with tags, the quantities normalized to an annual level, and an energy-cost waterfall at unit and block level. The baseline is recorded for every indicator together with its reason.
- Root-cause tree per energy type. The intervention tree shows which piece of equipment contributes what percentage to the consumption of the given energy type. This is the KPI–PI–I breakdown (OGSM logic), which brings the big consumers to the surface.
- Load curve per process. The curve is most telling when you draw it per process (not per equipment): it shows the flexibility, the variability and the absolute level. A 100% inflexible process consumes the same regardless of the load; the ideal curve is flat, at the theoretical minimum. Every scatter is a “Why?” to be answered.
- Human intervening variables. Observing and interviewing the control-room and outdoor operators shows which human decisions influence energy efficiency and yield, separately for operation without APC and running with APC.
- Profit/hour from the yield side. The diagnosis of yield looks at the commercial interface (LP model, shadow prices) and the operator intervention too; the profit/hour model and uncovering the quality “giveaway” show where we are leaving money on the table.
The whole is tied together by cross-functional meetings (navigator, plant experts, technologist, maintenance), which review the ideas and curves gathered so far, and at the end lay down the result of the diagnosis at a future-state workshop. Of the dimensions, the Management Infrastructure and the Mindset & Behaviours are directly tied to the shift organization: here a good part of the baseline comes from the shift diary and the observation sheets.
Rollout in practice (mini-scenario)
Section titled “Rollout in practice (mini-scenario)”This is how you would run a two-week diagnosis as a shift supervisor or navigator. Choose a painful, measurable problem (e.g. “our furnace’s specific energy consumption scatters and is high”). In the first week you gather the data: a masterfile with the indicators and the baseline (with the reasons), a root-cause tree of the big consumers, and a load curve. In the second week you interview the control-room and outdoor operators, look at the real practice on the gemba, and benchmark the current state. At the end you lay down a current-state presentation on which the team agrees: “this is today’s consumption, this is the theoretical minimum, this is the size of the gap, and these are the root causes.” You do not yet design the solution here — that is delivered by the Design phase.
Homework. Choose an indicator in your own area, and draw a simple baseline for it with its reasons: what the current value is, what the theoretical minimum would be, and what the three biggest items are that make up the gap between the two. Do not yet propose a solution: just measure.
Common mistakes
Section titled “Common mistakes”- Answering the “how” already in the diagnosis. The team immediately produces solutions instead of measuring the current state. Why it’s a problem: you inevitably focus on the wrong problem. Instead: in the diagnosis record only the
what; thehowbelongs to the Design phase. - Design without a diagnosis. A solution built on assumption, not on fact data. Why it’s a problem: it misses, the real loss remains. Instead: first the baseline, then the plan.
- Measuring only the Operating System. The management system (MI) and the behaviour (M&B) are left out. Why it’s a problem: the solution will not be sustainable, it reverts. Instead: measure all three lenses.
- No baseline, or a baseline without reasons. The starting point is not recorded, or only the bare number. Why it’s a problem: progress (impact) is unmeasurable, the number misleads. Instead: a baseline for every indicator together with its reason.
- Analysis paralysis. The diagnosis drags on endlessly, never turning into a plan. Why it’s a problem: the momentum runs out, the diagnosis stays “analysis for the drawer.” Instead: a time frame (typically two weeks), then a mandatory current-state presentation.
- The TIP as Excel-filling. The plan is typed in mechanically. Why it’s a problem: the plan is the result of thinking, not of a table. Instead: first on paper, backward from the goal, with verbs, with week-scoped actions.
When NOT to use it? (the limits of the phase)
Section titled “When NOT to use it? (the limits of the phase)”The formal, two-week diagnosis is a strong tool, but not every situation calls for one. There are times when a different answer is the right one.
| Situation | Why (primarily) not the full diagnosis | The right answer |
|---|---|---|
| An acute safety event / incident is unfolding | there is no time to measure for two weeks, you must act immediately | first stabilize per the emergency procedure; the systematic investigation comes afterward |
| The problem is small and the root cause is known | the formal assessment overshoots for a single obvious cause | a “just do it” quick fix, recording the lesson |
| There is already a fresh, validated baseline | do not re-measure from scratch what you already know | update the existing current-state picture, do not start over |
| The organization is prone to analysis paralysis | the diagnosis may drag on endlessly | a strict time frame + a mandatory current-state presentation at the end |
Rule of thumb: the diagnosis is strongest when you are looking for a lasting solution to a recurring, systemic performance gap. For a one-off, small, or already-known-cause problem the full assessment slows you down; and in an acute safety matter you must act first.
Take it home (keys)
Section titled “Take it home (keys)”- Measure first, plan after — the diagnosis delivers the
what, thehowis the job of Design and Plan. - Measure all three dimensions (OS / MI / M&B), otherwise the solution reverts.
- Record the baseline with its reasons — without this, progress is unmeasurable and the number misleads.
- The loss is in the scatter: the load curve and the root-cause tree show where the big impact is.
- A time frame + a current-state presentation close the phase, so it does not turn into analysis paralysis.
- The output is the raw material of the TIP — a plan without a diagnosis is just an assumption.
Self-test
Section titled “Self-test”- Why is the sequence fixed, that the diagnosis measures the
what, and why must thehownot be answered here? Name one consequence if you swap them. - Name the three dimensions (OS / MI / M&B), and give one concrete diagnostic tool for each. Why is it not enough to measure only the first?
- What is the role of the current-state baseline, and why is a baseline misleading if you record only the number, not its reason?
How does it appear in digital practice?
Section titled “How does it appear in digital practice?”The principle of the diagnosis does not stop at paper or in the workshop: the same “measure first, plan after” logic is even stronger in a digital operation, because the current-state data arise by themselves, continuously, not from a campaign-like data collection. The mechanism differs, the principle is the same.
| Diagnosis element | Digital implementation | What it delivers |
|---|---|---|
| Data collection / baseline | automatic data recording (historian, e-log) with a timestamp | an always-at-hand, auditable current state |
| Root-cause tree / loss breakdown | KPI–PI–I dashboard, drill-down to the big items | the high-impact points are immediately visible |
| Uncovering variability | trend and scatter analysis, load curve automatically | the “Why?” questions come from data, not from memory |
| Operator observation / practice | digital shift handover and observation sheet | the trace of the human intervening variables remains |
| Current-state agreement | a shared, versioned current-state view | one source of truth, not competing presentations |
Connection to OPEREX (shift diary)
Section titled “Connection to OPEREX (shift diary)”The current-state observations, operator interviews and variable identifications uncovered during the diagnosis can be logged with a timestamp in the shift diary (OPEREX), so that the transformation’s starting base (baseline) leaves an auditable trail. The later impact measurement refers back to this: “where we were” does not live in a presentation but in the diary, retrievably. A good part of the data for the Management Infrastructure and the Mindset & Behaviours dimension comes precisely from here, from the daily shift routine.
Terminology (HU / EN)
Section titled “Terminology (HU / EN)”| Hungarian | English | Note |
|---|---|---|
| Diagnosztikai fázis | Diagnose phase | assessing the current state |
| Jelenállapot | Current state | the object of the diagnosis |
| Kiindulási bázis | Baseline | the reference point, together with reasons |
| Adatgyűjtés | Gather Data | the main activity of the diagnosis |
| Taktikai terv | Tactical Implementation Plan (TIP) | per-workstream Gantt plan |
| Munkafolyam | Workstream | the unit of improvement (e.g. Energy & Yield) |
| Gyökérok-fa | Intervention tree / KPI–PI–I | the breakdown of the loss |
| Terhelési görbe | Load curve | diagnostic tool: throughput vs. energy |
| Három dimenzió | OS / MI / M&B | the frame of the examination (the three lenses) |
The EN technical terms are validated from the Lean transformation source material (Diagnose / Gather Data / TIP / Load curve) and the established Lean canon.
What is the goal of the diagnostic phase in a Lean transformation?
A data-driven mapping of the current state and the identification of the root causes of the performance gaps, before the solutions are designed. Its output is the current-state baseline, against which later progress is measured.
Which three dimensions does the diagnosis examine?
The Operating System (the configuration of the process), the Management Infrastructure (the management systems: KPI, review, shift handover) and Mindset & Behaviours (thinking and behaviour). This is the three lenses of Lean; all three must be measured for sustainable change.
What is the difference between the diagnosis and the design phase?
The diagnosis answers the what question (what the current state and the root cause is), the design the how (what solution leads to the future state). The most common mistake is when the team tries to answer the how already in the diagnosis.
What is the output of the diagnosis?
The current-state baseline, that is, a shared, fact-based picture on which the team agrees. From this the Design and Plan phases produce the Tactical Implementation Plan (TIP), the tactical plan that drives the rollout.
Why is it not enough to measure only the technical process (OS)?
Because the technical solution stays alive only if the management system (MI) keeps track of it and the people (M&B) really do it differently. If the diagnosis leaves out the latter two, the change reverts.
Related concepts
Section titled “Related concepts”the transformation journey · the three lenses · lean-navigator · vsm · ogsm · gemba-walk · pdca · APC and soft sensors
Next step
Section titled “Next step”If you have understood this, from here it is worth going on — in this order:
- the transformation journey — the full transformation journey: where the diagnosis fits between the preparation, the pilot and the scaling.
- the three lenses — the three dimensions (OS / MI / M&B) in detail, the frame of the diagnosis.
- vsm — the value stream map, one of the most important diagnostic tools of the current-state assessment.
References / Further reading
Section titled “References / Further reading”- Mike Rother, John Shook: Learning to See: Value-Stream Mapping to Add Value and Eliminate Muda. Lean Enterprise Institute, 1999 — the current-state map as the backbone of the diagnosis.
- James P. Womack, Daniel T. Jones: Lean Thinking. Free Press, 1996 (expanded edition 2003) — identifying value and the value stream; “see the process first.”
- Mike Rother: Toyota Kata. McGraw-Hill, 2009 — “grasp the current condition” as the precondition for setting the target state.
- W. Edwards Deming: Out of the Crisis. MIT Press, 1986 — the foundational work of PDCA/PDSA and data-driven management.